
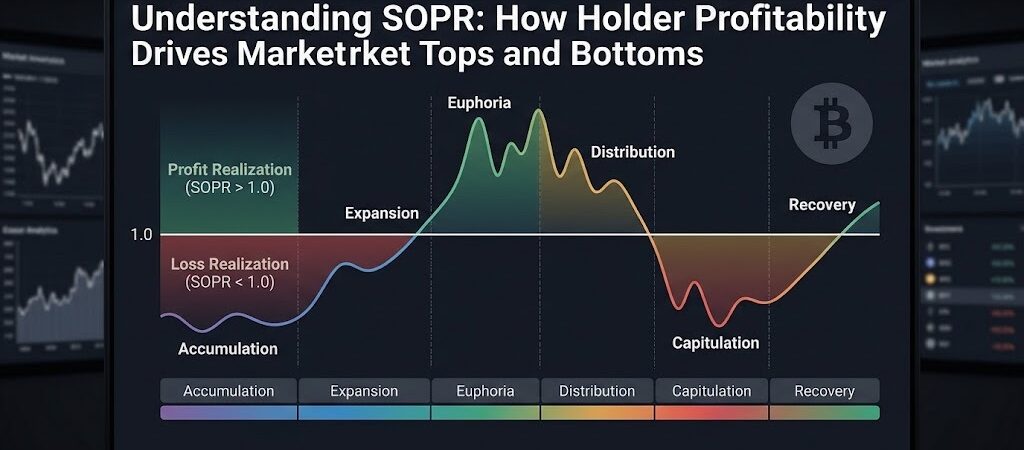
Introduction — What Is SOPR and Why Does It Matter?
Bitcoin’s blockchain contains more than transaction records. It also provides valuable information about how investors behave when they move their coins. One of the most useful on-chain metrics for studying this behavior is SOPR, or Spent Output Profit Ratio.
SOPR measures the profitability of coins that are being spent on-chain. In simple terms, it compares the value of a Bitcoin output when it is spent with the value it had when it was originally created. This allows analysts to estimate whether coins being moved are, on average, being sold at a profit or at a loss.
This makes SOPR particularly valuable because market prices alone do not tell the entire story. Bitcoin can rise sharply while investors remain reluctant to sell, or prices can fall while holders are realizing significant losses. SOPR provides another perspective by showing the economic outcome associated with coins that are actually being spent.
The Basic Idea Behind SOPR
The concept is straightforward:
SOPR = Realized Value of Spent Outputs ÷ Value at Creation
Another simple way to think about it is:
SOPR = Selling Price ÷ Original Acquisition Price
For example, imagine a Bitcoin holder acquired a portion of BTC when its value was $50,000 and later spent it when its value was $60,000. The resulting ratio would be:
$60,000 ÷ $50,000 = 1.20
A SOPR value of 1.20 indicates that the coin was moved at a 20% profit relative to its previous acquisition value.
By contrast, if the same coin had been spent when its value was $45,000:
$45,000 ÷ $50,000 = 0.90
That would represent a 10% loss.
Glassnode defines SOPR values above 1 as indicating that the average coin moved was sold at a profit, while values below 1 indicate that the average coin was sold at a loss.
Why the 1.0 Level Is So Important
The 1.0 level, often called the parity or break-even level, is one of the most important reference points when analyzing SOPR.
It can be interpreted in three basic ways:
- SOPR above 1.0: Coins are being moved at an aggregate profit.
- SOPR around 1.0: Coins are being moved close to their previous acquisition value.
- SOPR below 1.0: Coins are being moved at an aggregate loss.
This simple framework allows investors to observe changes in market psychology through realized behavior rather than relying exclusively on price charts.
When SOPR remains above 1 during a strong market, it can indicate that profitable holders are willing to realize gains while the market continues to absorb that selling. When SOPR repeatedly falls below 1, it can indicate that holders are realizing losses, which may occur during periods of weakness, fear, or forced selling.
However, SOPR should not be treated as a standalone buy-or-sell signal. It is better understood as a behavioral and profitability indicator that becomes more informative when combined with price trends, market structure, volume, liquidity, and other on-chain metrics.
SOPR and Market Psychology
The real value of SOPR goes beyond simply identifying profit or loss.
It helps us ask an important question:
What are Bitcoin holders actually doing with their coins as the market changes?
During bullish periods, investors who bought at lower prices may have substantial unrealized gains. As prices rise, some of these holders begin spending their coins and realizing profits. SOPR can therefore remain above 1 as profitable spending increases.
During bearish periods, the situation can change dramatically. Investors who purchased at higher prices may begin selling below their acquisition cost. SOPR can move below 1 as loss realization becomes more common.
This creates a connection between price, profitability, and investor psychology.
Glassnode’s early research on SOPR highlighted different behaviors during bull and bear markets and showed how the metric can be used to study Bitcoin market cycles.
Why SOPR Is Useful for Studying Market Tops and Bottoms
Market tops and bottoms are rarely created by one metric or one event. They generally develop through a combination of changing liquidity, investor expectations, profit-taking, fear, leverage, and shifts in demand.
SOPR can contribute to this analysis because it reveals whether the coins being spent are generating profits or losses.
At potential market tops, persistent profit realization can become an important part of the market’s behavior. As more holders have large unrealized gains, the incentive to take profits can increase. If demand is strong enough to absorb this selling, the market may continue higher. If demand weakens while profit realization remains elevated, selling pressure can become more significant.
At potential market bottoms, widespread loss realization can provide a different signal. Investors who bought at higher prices may capitulate, transferring coins to new owners who are willing to buy at lower prices. When selling pressure eventually declines and SOPR begins recovering toward or above the 1.0 level, it can provide useful evidence that the market’s profitability conditions are changing.
The important point is that SOPR does not predict a top or bottom with certainty. Instead, it helps analysts understand whether market participants are realizing profits or losses and how that behavior is changing over time.
That distinction is essential when using on-chain analytics responsibly.
What SOPR Adds to Bitcoin Analysis
Traditional technical analysis focuses heavily on price, volume, momentum, and market structure. On-chain analysis adds another dimension by examining what is happening with the assets themselves.
SOPR helps bridge these two approaches.
Instead of asking only:
“Is Bitcoin going up or down?”
SOPR encourages a deeper question:
“Are the coins currently moving through the network being spent at a profit or at a loss?”
That information can reveal changes in holder behavior that may not be immediately obvious from price alone.
For example, two Bitcoin markets could have similar price charts but very different underlying profitability conditions. In one market, holders may be steadily taking profits while demand remains strong. In another, investors may be selling at losses because confidence is deteriorating. SOPR can help distinguish between these environments.
A Simple SOPR Framework
| SOPR Reading | General Interpretation | Possible Market Context |
|---|---|---|
| Above 1.0 | Coins moving at a profit | Profit realization / stronger market |
| Near 1.0 | Coins moving around break-even | Market equilibrium / transition |
| Below 1.0 | Coins moving at a loss | Loss realization / weaker market |
| Repeated recovery above 1.0 | Profitability improving | Potential strengthening |
| Persistent weakness below 1.0 | Loss realization remains dominant | Potential continued stress |
These interpretations are context-dependent, not guaranteed market signals.
The Bigger Picture
SOPR becomes much more powerful when it is viewed as part of a broader on-chain framework.
Metrics such as MVRV, Realized Profit/Loss, Net Unrealized Profit/Loss (NUPL), exchange flows, and holder behavior can provide additional information about the state of the market.
For example, MVRV can help estimate the relationship between Bitcoin’s market value and realized value, while SOPR focuses specifically on the profitability of coins that are being spent. Together, these metrics can provide a more complete picture of market valuation and realized investor behavior.
This is why SOPR deserves a place among the most important on-chain metrics for understanding Bitcoin market cycles.
How SOPR Is Calculated and Interpreted
Understanding what SOPR measures is only the first step. To use the metric effectively, it is important to understand how SOPR is calculated, what a spent output represents, and why the 1.0 threshold matters so much.
Unlike traditional market indicators that are calculated primarily from price or volume data, SOPR is derived from Bitcoin’s blockchain history. It connects the value of coins when they were previously acquired with their value when they are later spent.
This gives analysts a way to observe realized profitability directly from on-chain activity.
How Does SOPR Work?
Bitcoin uses a transaction model known as the Unspent Transaction Output (UTXO) model. Rather than treating a wallet balance as one single account balance, the Bitcoin network tracks individual transaction outputs that can later be spent.
When a Bitcoin output is created, its value and creation price can be recorded. When that output is eventually spent, analysts can compare its previous value with its value at the time of spending.
SOPR aggregates these realized profit and loss relationships across the relevant spent outputs.
The simplified formula is:
SOPR = Realized Value of Spent Outputs ÷ Value of Those Outputs at Creation
In practical terms, the calculation asks:
“At what multiple of their previous acquisition value are the coins currently being spent?”
A result greater than 1 indicates aggregate profit realization, while a result below 1 indicates aggregate loss realization.
A Simple Example
Consider three Bitcoin holders who acquired coins at different prices.
- Holder A acquired BTC at $40,000 and spends it at $60,000.
- Holder B acquired BTC at $50,000 and spends it at $60,000.
- Holder C acquired BTC at $70,000 and spends it at $60,000.
The first holder realizes a profit, the second is approximately at break-even, and the third realizes a loss.
The market therefore contains both profit-taking and loss realization at the same time.
This is important because SOPR is an aggregate metric. It does not tell us that every holder is profitable or every transaction is occurring at a loss.
Instead, it summarizes the profitability of the coins being spent across the measured population.
Understanding SOPR Above 1
When SOPR is above 1.0, the aggregate value of spent outputs is greater than their value when those outputs were created.
This means the coins being spent are, on average, realizing profits.
For example:
SOPR = 1.15
This can be interpreted as spent coins realizing approximately 15% more value than their previous acquisition value, in aggregate terms.
A rising SOPR above 1 can therefore indicate increasing profit realization.
However, profit realization is not automatically bearish.
This is one of the most important concepts to understand.
If investors take profits while new buyers continue providing enough demand, the market can absorb that selling and continue rising. In a strong bull market, profit-taking can occur repeatedly without ending the trend.
Therefore:
High SOPR ≠ automatic market top.
The broader market context matters.
Understanding SOPR Below 1
When SOPR falls below 1.0, the coins being spent are, on average, being realized at a loss.
For example:
SOPR = 0.90
This suggests that the spent coins are realizing approximately 10% less value than their previous acquisition value, in aggregate terms.
Persistent readings below 1 can appear during periods when investors are unwilling or unable to wait for prices to recover.
This may happen during:
- Bear markets
- Sharp market corrections
- Panic selling
- Capitulation
- Liquidity stress
- Forced selling
- Periods of declining investor confidence
Again, a low SOPR does not automatically mean that a market bottom has arrived.
Loss realization can continue for an extended period during a prolonged bear market.
Why SOPR = 1 Is the Key Threshold
The 1.0 level represents the approximate break-even point.
When SOPR is exactly 1:
Realized Value = Value at Creation
In simplified terms, the coins being spent are moving at approximately their previous acquisition value.
This makes the 1.0 level particularly useful when studying changes in market regime.
The relationship can be summarized as:
SOPR > 1 → Profit realization
SOPR = 1 → Break-even
SOPR < 1 → Loss realization
But the most interesting information often comes from how SOPR behaves around 1, rather than from a single reading.
SOPR Reclaiming 1
One potentially important pattern occurs when SOPR falls below 1 and later recovers above it.
During a weak market, holders may repeatedly realize losses. If the market eventually strengthens and SOPR begins holding above 1, it can suggest that the profitability environment is improving.
This does not guarantee a new bull market.
Instead, it can indicate a change in holder behavior.
The transition can look like:
Persistent loss realization → stabilization → break-even → renewed profit realization
When this pattern occurs alongside improving price structure and demand, it can provide stronger evidence of a changing market environment.
SOPR Rejection at 1
The opposite behavior can also be informative.
Suppose SOPR rises toward 1 during a weak market but repeatedly fails to sustain a move above it.
This may indicate that holders continue to encounter selling pressure around their acquisition prices.
In a bearish environment, the 1.0 level can therefore become a meaningful psychological and behavioral threshold.
If investors who bought near previous highs are finally able to exit around break-even, some may choose to sell rather than continue holding.
That can create additional supply around the break-even level.
This is one reason analysts pay close attention to SOPR’s relationship with 1.
SOPR Is About Realized Profitability
An important distinction must be made between realized profit and unrealized profit.
Imagine Bitcoin is trading at $100,000 and an investor purchased it at $50,000.
The investor has an unrealized gain of approximately $50,000.
But that gain does not become realized until the investor spends or sells the relevant Bitcoin.
SOPR is designed to study the profitability associated with spent coins.
This makes it different from valuation metrics that estimate the profitability of coins that are still being held.
The distinction can be summarized simply:
Unrealized profit = What holders could gain if they sold
Realized profit = What holders actually lock in when coins are spent
SOPR focuses on the second concept.
Why Realized Behavior Matters
Market participants often talk about what investors might do.
SOPR gives analysts an opportunity to examine what holders are actually doing with coins that move on-chain.
When Bitcoin prices rise substantially, many long-term holders may sit on significant unrealized gains.
If they begin spending those coins, SOPR can capture the profitability associated with that movement.
Likewise, during a major decline, investors who purchased near higher prices may eventually sell below their acquisition price.
SOPR can capture this loss realization.
This makes the metric useful for studying changes in investor behavior throughout different stages of the market cycle.
SOPR Does Not Track Every Holder Equally
Another important consideration is that not every Bitcoin holder behaves in the same way.
A long-term holder who purchased Bitcoin several years ago may have a very different cost basis from a short-term trader who purchased recently.
If both holders spend coins at the same market price, their realized profitability can be dramatically different.
For example:
Long-term holder
Purchase price: $20,000
Spending price: $60,000
Approximate multiple: 3.0
Recent buyer
Purchase price: $55,000
Spending price: $60,000
Approximate multiple: 1.09
Both are spending Bitcoin at the same market price, but their profitability profiles are completely different.
This is why understanding holder cohorts becomes important when interpreting SOPR.
The Importance of Time
SOPR is also highly sensitive to the time period being examined.
A short-term move above 1 may simply reflect temporary profit-taking.
A sustained period above 1 can tell a different story.
Similarly, one brief dip below 1 does not necessarily indicate capitulation or the beginning of a bear market.
Analysts therefore look for:
- Persistent trends
- Repeated tests of the 1.0 level
- Changes in the magnitude of profit realization
- Changes in loss realization
- Confirmation from price action
- Confirmation from other on-chain metrics
The behavior of SOPR over time is generally more informative than one isolated value.
SOPR and Market Cycle Analysis
SOPR can be particularly useful when studying Bitcoin’s broader market cycles.
A simplified cycle framework might look like this:
Accumulation → Recovery → Expansion → Profit Taking → Distribution → Decline → Capitulation → Recovery
Different phases can produce different profitability conditions.
During accumulation, investors may gradually acquire coins at depressed prices.
During recovery, SOPR may begin transitioning from persistent loss realization toward break-even and profit realization.
During expansion, profitable spending can increase as more holders gain unrealized profits.
During distribution, increasing profit realization may become more significant if demand begins weakening.
During decline, loss realization can become increasingly important as holders sell below their acquisition prices.
Finally, during capitulation and subsequent recovery, SOPR behavior may begin changing again as selling pressure diminishes and new market participants establish lower-cost positions.
This framework is not a fixed formula for predicting cycles. Markets can behave differently from one cycle to another.
Instead, SOPR provides a behavioral lens through which analysts can examine those transitions.
A Practical Interpretation Framework
When looking at SOPR, avoid asking only:
“Is SOPR above or below 1?”
Ask several questions instead:
- Where is SOPR relative to 1?
- Is it rising or falling?
- Has the current condition persisted?
- Are investors realizing increasingly large profits or losses?
- Is price confirming the same market regime?
- Are other on-chain metrics providing similar evidence?
- Which holder group appears to be responsible for the activity?
These questions transform SOPR from a simple number into a broader market-analysis tool.
Key Takeaway
SOPR is fundamentally a measure of realized holder profitability.
Its most important reference point is 1.0, which represents approximate break-even conditions.
Above 1, spent coins are realizing aggregate profits. Below 1, spent coins are realizing aggregate losses. But neither condition should be interpreted as an automatic prediction of a market top or bottom.
The real analytical value comes from observing how SOPR changes over time, particularly around the 1.0 threshold, and combining that information with price structure and other market indicators.
SOPR and Bitcoin Market Tops
One of the most interesting applications of SOPR is analyzing what happens when Bitcoin approaches periods of extreme profitability.
During a strong bull market, the number of coins sitting on unrealized gains can increase significantly. As Bitcoin’s price moves higher, some holders eventually decide to lock in those gains by spending their coins. SOPR can capture this behavior by showing that the coins being spent are realizing profits.
This creates an important relationship between rising prices, holder profitability, and profit realization.
However, there is a major distinction investors need to understand:
Profit-taking does not automatically mean a market top.
In healthy bull markets, investors can realize substantial profits while Bitcoin continues climbing because new demand absorbs the selling pressure.
The challenge is determining when profit realization is simply part of a healthy market and when it becomes part of a broader distribution process.
How SOPR Behaves During Bull Markets
During the early stages of a Bitcoin bull market, many holders may still be recovering from previous losses or may have relatively modest unrealized gains.
As prices continue higher, more coins move into profit.
This can gradually change the behavior of market participants.
Investors who purchased at lower prices may begin taking partial profits. Other participants may rotate capital into different assets. Short-term traders may close profitable positions.
As these coins are spent, SOPR can remain above 1.
A simplified progression can look like:
Price recovery → More coins become profitable → Holders begin taking profits → SOPR moves above 1 → Demand absorbs selling → Market continues higher
This is why a rising SOPR can actually be compatible with a healthy bull market.
The market does not necessarily need investors to hold every coin forever for prices to continue increasing.
Instead, ownership can transfer from older holders realizing gains to newer buyers willing to acquire Bitcoin at higher prices.
Elevated SOPR Does Not Mean “Sell Now”
One of the most common mistakes when using SOPR is treating a high reading as an automatic sell signal.
That approach is too simplistic.
Suppose SOPR rises significantly above 1 while Bitcoin is experiencing strong demand and improving market structure.
The elevated reading tells us that profitable spending is occurring.
It does not tell us that buyers have disappeared.
If demand continues to exceed the amount of Bitcoin being offered by sellers, the market can absorb profit-taking and continue higher.
This is why SOPR should be interpreted together with other evidence.
For example:
- Bitcoin price trend
- Trading volume
- Liquidity conditions
- Exchange flows
- Realized profit
- Market valuation
- Long-term holder behavior
- Short-term holder behavior
- Derivatives positioning
The more independent indicators point toward distribution, the more meaningful elevated profit realization may become.
Healthy Profit-Taking vs. Distribution
This distinction is essential.
Healthy Profit-Taking
In a strong market, investors may realize profits without causing a major deterioration in demand.
The pattern could look like:
Strong demand + moderate profit realization + rising price
Here, SOPR may remain above 1 while Bitcoin continues establishing higher highs and higher lows.
Profit-taking is simply part of the market’s normal process.
Potential Distribution
A more concerning pattern can emerge when profit realization becomes persistent while demand begins weakening.
The pattern could look like:
Heavy profit realization + weakening demand + slowing price momentum
In this environment, sellers may increasingly overwhelm buyers.
SOPR alone cannot confirm distribution, but it can contribute important evidence to the analysis.
The difference is therefore not simply high SOPR versus low SOPR.
It is the relationship between profit realization and the market’s ability to absorb that selling.
Why Market Tops Can Develop Slowly
Bitcoin market tops are rarely created by a single transaction or one sudden change in SOPR.
They often develop through a gradual process.
As prices rise, more holders become profitable. Some begin taking profits. New buyers enter the market and absorb the supply.
If demand remains strong, the process can continue.
Eventually, however, market conditions can change.
Potential new buyers may become less aggressive. Existing holders may have fewer reasons to keep increasing exposure. Profit-taking can increase while demand slows.
The balance between buyers and sellers can then begin shifting.
This is why analysts should focus on changes in behavior, rather than treating any single SOPR reading as a definitive top signal.
SOPR and Realized Profit
SOPR becomes particularly interesting when compared with broader realized-profit metrics.
SOPR focuses on the profitability of spent outputs, while realized-profit measures can provide information about the dollar value of gains actually realized by the network.
Imagine Bitcoin rises from $60,000 to $100,000.
A large number of holders may now be sitting on substantial gains.
If many of those holders begin spending coins, SOPR can show profitable spending.
At the same time, aggregate realized profit may become large.
When both measures increase alongside extreme market valuations and weakening demand, analysts may have stronger evidence that profit-taking is becoming an important market force.
But again, confirmation is critical.
The Importance of SOPR Persistence
A single SOPR spike can be caused by temporary market activity.
For example, a short-lived price surge can encourage traders and holders to realize profits.
That does not necessarily indicate a cycle top.
A more persistent pattern can be more informative.
Analysts may ask:
Is SOPR repeatedly elevated?
Are profitable coins being spent at an increasing rate?
Is price still accelerating?
Is demand keeping pace with realized selling?
Are other indicators showing signs of overheating?
These questions help separate ordinary profit realization from potentially more significant changes in market structure.
SOPR During Late-Stage Bull Markets
Late-stage bull markets can create an environment where realized profitability becomes increasingly important.
After a prolonged price increase, many investors may hold substantial unrealized gains.
Some long-term holders may begin distributing portions of their holdings.
Short-term participants may also become increasingly active.
This can produce repeated periods of elevated SOPR.
However, the exact behavior can vary between market cycles.
One cycle may experience relatively gradual profit realization, while another may experience extremely aggressive speculative activity.
Therefore, historical SOPR patterns should be used as context, not as a rigid template.
A Hypothetical Example
Imagine Bitcoin moves through the following stages:
Stage 1 — Recovery
Bitcoin rises from $45,000 to $60,000.
SOPR gradually moves above 1 as holders begin realizing profits.
Stage 2 — Expansion
Bitcoin rises from $60,000 to $80,000.
SOPR remains above 1, but demand continues absorbing realized profits.
The market continues higher.
Stage 3 — Strong Bull Market
Bitcoin reaches $100,000.
More holders have significant unrealized gains, and profitable spending increases.
SOPR remains elevated.
But price continues rising because demand remains strong.
Stage 4 — Potential Distribution
Bitcoin reaches $110,000 but begins struggling to make meaningful new highs.
Profit realization remains elevated.
Demand appears to weaken.
Momentum begins deteriorating.
At this point, elevated SOPR may become more relevant because the market appears less capable of absorbing realized profits.
Notice the difference.
The same SOPR behavior — profitable spending — can occur during both healthy expansion and potential distribution.
The surrounding market conditions determine its significance.
Why SOPR Cannot Predict the Exact Top
There is an important limitation to remember.
SOPR is a descriptive behavioral metric, not a crystal ball.
It tells us what happened to the profitability of spent coins.
It does not know:
- How much new capital will enter tomorrow
- Whether institutions will increase exposure
- Whether macroeconomic conditions will change
- Whether liquidity will expand
- Whether investors will suddenly become more risk-seeking
- Whether a major market event will change sentiment
As a result, SOPR can help identify conditions associated with market stress or strong profit realization, but it cannot guarantee that a specific price represents the final cycle top.
This is especially important in fast-moving cryptocurrency markets.
SOPR and the Psychology of Profit
Behind every SOPR reading is investor behavior.
When Bitcoin holders see substantial gains, they face a decision:
Hold or realize the profit?
Some investors may sell their entire position.
Others may take partial profits.
Some may sell only enough to recover their initial investment.
Others may continue holding because they expect even higher prices.
The aggregate outcome of these decisions contributes to the profitability behavior reflected by SOPR.
This makes the metric useful from a behavioral-finance perspective.
Rather than simply observing that Bitcoin is expensive, analysts can examine whether profitable holders are actually beginning to realize those gains.
The Role of New Buyers
Profit-taking becomes particularly important because every seller needs a buyer.
When older holders spend profitable coins, those coins do not disappear from the Bitcoin network.
Ownership can simply transfer to another participant.
This means rising SOPR can occur alongside rising prices if new demand is strong enough.
For example:
Long-term holder sells at a large profit → New investor buys → Bitcoin demand remains strong → Price continues higher
In this situation, elevated profit realization is not necessarily bearish.
The problem develops when the supply being released by profitable holders becomes larger than the demand available to absorb it.
This is why SOPR should be viewed as part of a supply-and-demand framework rather than as an isolated reversal indicator.
A Practical Checklist for Potential Tops
When SOPR becomes elevated during a strong Bitcoin rally, investors can consider several questions:
- Is Bitcoin still making higher highs?
- Is demand continuing to absorb realized profits?
- Is SOPR elevated temporarily or persistently?
- Are realized profits increasing sharply?
- Are long-term holders distributing more coins?
- Is market valuation becoming historically stretched?
- Are momentum indicators weakening?
- Are exchange inflows increasing?
- Is leverage becoming excessive?
- Are multiple on-chain indicators confirming the same risk?
The purpose of this checklist is not to predict the exact top.
Instead, it helps investors determine whether profit realization is occurring within a healthy uptrend or alongside increasingly fragile market conditions.
Key Takeaway
SOPR provides an important window into how Bitcoin holders realize profits during market expansions.
Elevated SOPR means that spent coins are, in aggregate, being realized at profits. This can happen during strong bull markets and does not automatically indicate that Bitcoin has reached a cycle top.
The more important question is whether the market can continue absorbing that profit-taking.
When elevated profit realization is accompanied by weakening demand, slowing momentum, deteriorating market structure, and confirmation from other on-chain indicators, SOPR can become more useful as part of a broader top-risk analysis.
SOPR and Bitcoin Market Bottoms
If elevated SOPR can help us understand profit-taking during strong markets, the opposite side of the equation is equally important.
When Bitcoin prices fall significantly, investors who purchased at higher prices can begin realizing losses. This behavior can push SOPR below the critical 1.0 level and provide valuable information about market stress.
For analysts studying Bitcoin market bottoms, this makes SOPR particularly interesting.
But there is an important principle to remember:
A low SOPR does not automatically mean the market has reached its bottom.
Loss realization can continue for weeks or months during a prolonged bear market. The more useful signal often comes from observing how SOPR behaves after periods of persistent loss realization.
What Happens to SOPR During a Market Decline?
During a major Bitcoin decline, the profitability profile of holders can change rapidly.
Investors who purchased Bitcoin at higher prices may suddenly find themselves holding unrealized losses. Some may continue holding and wait for recovery. Others may decide that preserving capital is more important and sell despite the loss.
When these coins are spent below their previous acquisition value, SOPR moves below 1.
A simplified cycle can look like:
Price decline → Unrealized losses increase → Holders begin selling → Loss realization increases → SOPR falls below 1
If selling pressure becomes severe, SOPR can remain below 1 for an extended period.
This can provide evidence that the market is experiencing significant financial stress.
SOPR Below 1 and Investor Capitulation
One of the most important concepts associated with market bottoms is capitulation.
Capitulation occurs when investors who have become exhausted, fearful, or unwilling to tolerate further losses decide to sell.
During capitulation:
- Loss realization can increase sharply.
- Weak holders may exit the market.
- Selling pressure can become intense.
- Market sentiment can deteriorate.
- Bitcoin prices can experience significant volatility.
SOPR can capture part of this process because coins being spent at losses push the metric below 1.
However, not every SOPR decline represents capitulation.
A modest move below 1 may simply reflect normal profit-and-loss fluctuations.
The surrounding market conditions remain essential.
Persistent SOPR Weakness Can Signal Market Stress
A single day below 1 is usually much less informative than a prolonged period below 1.
If SOPR repeatedly remains under the break-even level, it suggests that the coins being spent are consistently realizing losses.
This can occur during severe bear markets.
The pattern may look like:
SOPR < 1 → Recovery toward 1 → Rejection → SOPR < 1 again
When this behavior persists, it can indicate that investors are repeatedly encountering losses and that the market has not yet established a durable recovery.
This is why analysts often examine trends and repeated behavior rather than isolated readings.
Why Loss Realization Can Eventually Become Constructive
At first, widespread loss realization appears entirely negative.
However, from a market-cycle perspective, the process can also help reset ownership.
When distressed holders sell their Bitcoin, ownership can transfer to participants who are willing to buy at lower prices.
These new investors generally establish a lower acquisition cost.
Over time, the market’s aggregate cost basis can therefore change.
This process can contribute to the transition from a weak market toward a more stable one.
The important point is not that losses themselves are bullish.
Rather:
Loss realization can remove weaker positions and create the conditions for new ownership at lower prices.
The Difference Between Panic and Exhaustion
A market bottom is not necessarily created at the moment fear reaches its highest level.
Markets can experience several waves of selling.
For example:
Initial decline → Panic selling → Temporary recovery → Another decline → Additional loss realization → Selling exhaustion
SOPR can fluctuate throughout this process.
This is why attempting to identify a bottom using one low reading can be dangerous.
Instead, analysts should watch for evidence that the intensity of loss realization is declining.
If SOPR stops making increasingly weak readings and begins stabilizing, the market may be entering a different phase.
SOPR Recovery Toward 1
One of the most closely watched developments after a prolonged period of weakness is a recovery toward the 1.0 level.
Imagine SOPR spends an extended period below 1.
Eventually, selling pressure decreases.
As Bitcoin’s price stabilizes and new buyers enter the market, fewer holders may need to sell at significant losses.
SOPR can then begin moving upward.
The progression may look like:
Persistent loss realization → Declining selling pressure → SOPR stabilizes → SOPR approaches 1 → Break-even becomes achievable
This transition can be an important sign that market conditions are improving.
But again, reaching 1 does not guarantee that a new bull market has begun.
Why Reclaiming 1 Can Matter
A sustained move above 1 can provide additional confirmation that the profitability environment has improved.
Consider a market that has experienced months of loss realization.
If SOPR finally rises above 1 and remains there, it suggests that spent coins are once again being realized at aggregate profits.
That can indicate that a meaningful number of market participants have moved from loss-making transactions to profitable ones.
If this occurs alongside:
- Higher market lows
- Improving demand
- Rising liquidity
- Stronger trading activity
- Improving investor sentiment
- Better on-chain conditions
then the SOPR recovery can become more meaningful.
The important concept is confirmation.
SOPR and the “Break-Even” Battle
The 1.0 level can become particularly interesting during market recovery.
Investors who purchased Bitcoin during the decline may have acquired coins at lower prices.
Meanwhile, older holders may still have higher acquisition prices.
As Bitcoin recovers, different groups reach break-even at different prices.
Some investors may sell when they finally return to their original purchase price.
Others may hold because they expect the recovery to continue.
This can create temporary selling pressure around psychologically important levels.
SOPR therefore provides a way to observe how the market responds as holders move from loss realization toward profitability.
A Hypothetical Bottoming Process
Consider a hypothetical Bitcoin bear market.
Stage 1 — Major Decline
Bitcoin falls sharply from $100,000 to $70,000.
Many recent buyers are now sitting on losses.
SOPR begins moving below 1.
Stage 2 — Capitulation
Bitcoin falls further to $55,000.
Fear increases and some investors sell regardless of price.
Loss realization becomes intense.
SOPR remains significantly below 1.
Stage 3 — Stabilization
Bitcoin stops falling rapidly and begins trading around $50,000–$60,000.
Some investors continue selling, but the intensity of loss realization begins declining.
SOPR starts stabilizing.
Stage 4 — Recovery
Bitcoin begins establishing higher lows.
Demand improves.
SOPR gradually moves toward 1.
Stage 5 — Break-Even Reclaim
Bitcoin eventually rises above previous acquisition levels for an increasing number of active holders.
SOPR moves above 1.
If the metric remains above 1 while price structure improves, this can provide stronger evidence that the market has transitioned into a healthier environment.
This is a framework for understanding market behavior, not a guaranteed bottom-finding strategy.
Why the Lowest SOPR Reading May Not Be the Bottom
An important misconception is that the lowest SOPR value must occur exactly at the market bottom.
That is not necessarily true.
Different holders have different acquisition prices and different reasons for selling.
Some investors may capitulate before the final price low.
Others may sell after the market has already started recovering.
Large on-chain transactions can also affect the metric without representing broad market capitulation.
Therefore, the lowest SOPR reading should not automatically be treated as the exact bottom.
Instead, analysts should study the sequence of events.
Declining Loss Realization Can Be More Important
Imagine SOPR falls to 0.85 during a major sell-off.
Later, it rises to 0.90.
Then 0.95.
Finally, it approaches 1.
Even though SOPR remains below 1 during much of this period, the direction is changing.
The market is moving from deeper loss realization toward break-even.
This can be more informative than simply observing that SOPR is still below 1.
In other words:
The trend in profitability can matter more than one absolute reading.
SOPR and Market Sentiment
Bitcoin market bottoms are often associated with extremely negative sentiment.
Investors may become pessimistic about future prices and increasingly focused on avoiding further losses.
SOPR provides an on-chain perspective on this psychological process.
When widespread selling occurs at losses, the blockchain records evidence of that behavior.
This does not directly measure emotions.
Instead, it provides a measurable economic outcome of investor decisions.
That distinction matters.
SOPR cannot tell us exactly how investors feel, but it can show that coins are being spent at increasingly unfavorable prices.
Short-Term Holders Can Be Especially Important
Not all holder groups react to market declines in the same way.
Recent buyers tend to have acquisition prices that are closer to the current market price. As a result, they can move from profit to loss relatively quickly.
Long-term holders who purchased Bitcoin much earlier may still remain profitable even during substantial corrections.
This difference can create very different profitability behavior across holder cohorts.
That is why more advanced SOPR analysis often separates different groups rather than relying exclusively on aggregate SOPR.
Understanding these cohorts can help analysts determine who is realizing losses and who is continuing to hold.
SOPR Bottom Signals Need Confirmation
A responsible bottom-analysis framework should never rely on SOPR alone.
Instead, analysts can combine SOPR with other indicators such as:
- MVRV for market valuation
- NUPL for unrealized profitability
- Realized Profit/Loss for aggregate realized outcomes
- Exchange flows for potential changes in exchange-held supply
- Long-term holder behavior
- Short-term holder behavior
- Bitcoin price structure
- Trading volume
- Liquidity conditions
If several independent indicators begin showing evidence of capitulation, stabilization, and recovery at the same time, confidence in the broader market interpretation can improve.
A Practical Bottom Checklist
When SOPR remains below 1 during a Bitcoin decline, analysts can ask:
- How long has SOPR remained below 1?
- Is loss realization increasing or decreasing?
- Has selling pressure begun to weaken?
- Is Bitcoin establishing a higher low?
- Are new buyers returning?
- Is SOPR moving progressively closer to 1?
- Does MVRV show signs of depressed valuation?
- Are long-term holders accumulating or distributing?
- Are realized losses becoming less severe?
- Are multiple indicators confirming stabilization?
This approach helps avoid the common mistake of treating one low SOPR reading as a guaranteed bottom.
The Bigger Lesson
The most useful way to think about SOPR during market bottoms is not:
“SOPR is below 1, therefore buy Bitcoin.”
A better interpretation is:
“SOPR is showing persistent loss realization. What does the trend tell us about selling pressure, holder behavior, and the possibility of stabilization?”
That question encourages a much more disciplined approach to on-chain analysis.
A bottom is ultimately formed through changing supply and demand conditions, not through one indicator.
SOPR simply provides valuable evidence about the profitability of coins that are being spent during that process.
Key Takeaway
SOPR can provide important insight into the behavior of Bitcoin holders during market declines.
When SOPR falls below 1, spent coins are being realized at aggregate losses. Persistent weakness can indicate significant market stress, while extreme loss realization may accompany capitulation.
The potentially more constructive development occurs when loss realization begins declining, SOPR stabilizes, and the metric gradually moves back toward the 1.0 break-even level.
A sustained recovery above 1, especially when confirmed by improving price structure and other on-chain indicators, can provide stronger evidence that market conditions are improving.
But SOPR should never be treated as a guaranteed bottom indicator.
The real power of SOPR comes from combining its profitability data with market structure, holder behavior, valuation, liquidity, and other on-chain metrics.
Short-Term Holder SOPR vs. Long-Term Holder SOPR
Aggregate SOPR provides a valuable overview of realized profitability across the Bitcoin network. However, it can sometimes hide an important detail:
Different groups of Bitcoin holders behave very differently.
A recent buyer who acquired Bitcoin a few days or weeks ago has a completely different cost basis from an investor who has held Bitcoin for several years.
If both participants spend their coins at the same market price, their realized profitability can be dramatically different.
This is why analysts often examine Short-Term Holder SOPR (STH-SOPR) and Long-Term Holder SOPR (LTH-SOPR) separately.
By dividing holders into different time-based cohorts, analysts can gain a clearer view of who is realizing profits, who is realizing losses, and how investor behavior changes throughout a market cycle.
What Is Short-Term Holder SOPR?
Short-Term Holder SOPR focuses on coins that have been held for a relatively short period before being spent.
These participants are generally considered more sensitive to recent price movements because their acquisition prices are closer to the current market price.
Short-term holders can include:
- New market participants
- Recent Bitcoin buyers
- Short-term traders
- Momentum-driven investors
- Participants entering during a current market trend
Because their coins were acquired relatively recently, their profitability can change quickly.
A small Bitcoin price decline can push recently purchased coins into an unrealized loss.
Likewise, a strong rally can quickly move those coins into profit.
Why Short-Term Holder SOPR Matters
STH-SOPR can provide insight into the behavior of the newer cohort of market participants.
Imagine Bitcoin has been rising strongly for several months.
Many new investors may have purchased during the rally.
If Bitcoin continues higher, those recent buyers can begin realizing profits.
STH-SOPR may therefore remain above 1.
But if Bitcoin suddenly declines, these newer participants can become vulnerable to losses much faster than long-term holders.
This can make STH-SOPR particularly useful for studying:
- Short-term market momentum
- Recent investor profitability
- Panic selling
- Local corrections
- Market recovery
- Changes in short-term confidence
STH-SOPR During Bull Markets
During a healthy Bitcoin uptrend, STH-SOPR can frequently remain above 1 because recent buyers are spending coins at profits.
For example:
A trader buys Bitcoin at $80,000.
Bitcoin rises to $95,000.
The trader sells or spends the coins.
The transaction represents a realized profit.
As more recent holders do this, STH-SOPR can reflect profitable behavior among the short-term cohort.
This does not necessarily mean the market is approaching a top.
In fact, repeated profitable spending by short-term holders can occur throughout a strong uptrend.
The important question is whether the market continues absorbing that selling.
STH-SOPR During Corrections
The short-term cohort can become more vulnerable when Bitcoin experiences a sharp correction.
Suppose recent buyers entered at $100,000 and Bitcoin falls to $90,000.
Some of those holders may decide to sell.
Because their acquisition prices are relatively high compared with the current market price, their transactions can contribute to loss realization.
STH-SOPR can therefore move below 1.
If the decline becomes severe, short-term holders may experience a significant deterioration in profitability.
This can create a cycle:
Price decline → Recent holders enter losses → Some sell → Loss realization increases → STH-SOPR weakens
Whether this develops into a larger market decline depends on broader demand and market conditions.
The 1.0 Level for Short-Term Holders
The 1.0 threshold is particularly interesting for STH-SOPR.
When STH-SOPR is above 1, recent holders are realizing aggregate profits.
When it is below 1, recent holders are realizing aggregate losses.
A recovery from below 1 toward 1 can indicate that recent holders are moving closer to break-even.
A sustained move above 1 can suggest that the newer cohort has regained profitable spending conditions.
This can be useful when studying Bitcoin’s transition from a weak market toward a recovery.
Short-Term Holder SOPR as a Market Stress Indicator
Because recent buyers have relatively fresh cost bases, their profitability can react quickly to changes in price.
This makes STH-SOPR useful for detecting periods when newer investors are under pressure.
For example:
Bitcoin falls sharply + STH-SOPR drops below 1 + loss realization increases
This combination can indicate that recent participants are experiencing financial stress.
If the market stabilizes afterward and STH-SOPR begins recovering, it can provide evidence that the short-term cohort is regaining confidence.
Again, this is not a guaranteed reversal signal.
What Is Long-Term Holder SOPR?
Long-Term Holder SOPR focuses on coins that have remained dormant for a much longer period before being spent.
These coins generally belong to investors with significantly older acquisition histories.
Long-term holders can include:
- Early Bitcoin investors
- Long-term investors
- Large holders with low acquisition costs
- Investors who accumulated during previous market cycles
- Participants who have remained inactive through multiple market phases
Because these holders often have much lower acquisition prices, their profitability can remain high even when Bitcoin experiences substantial corrections.
This gives LTH-SOPR a very different analytical role.
Why Long-Term Holder SOPR Matters
Long-term holders can represent a significant source of potential supply during major Bitcoin rallies.
Imagine an investor acquired Bitcoin at $20,000 and continues holding until the price reaches $100,000.
That investor has a very large unrealized gain.
If the investor eventually spends those coins, the transaction can represent substantial realized profitability.
LTH-SOPR can therefore provide clues about whether older profitable coins are beginning to move.
This can be particularly interesting during mature bull markets.
LTH-SOPR During Bull Markets
Long-term holders often behave differently from short-term traders.
They may tolerate significant volatility and remain inactive for long periods.
During strong bull markets, however, some long-term holders may gradually begin realizing profits.
This can create increasing realized profitability among older coins.
If LTH-SOPR rises while Bitcoin is experiencing a strong rally, analysts may examine whether long-term holders are beginning to distribute supply.
But once again:
Long-term holder profit realization does not automatically mean a market top.
A strong market can absorb significant long-term-holder selling if demand remains sufficiently strong.
LTH-SOPR and Distribution
Long-term holder behavior becomes particularly interesting during potential distribution phases.
If Bitcoin prices are elevated and older coins begin moving more actively, analysts may investigate whether long-term holders are taking profits.
A potential distribution environment might involve:
High market valuation + increased older-coin spending + strong realized profits + weakening demand
This combination can provide stronger evidence that mature holders are reducing exposure.
However, the metric should still be interpreted alongside other data.
The Difference Between STH-SOPR and LTH-SOPR
The two metrics answer different questions.
| Metric | Main Focus | Typical Behavior |
|---|---|---|
| STH-SOPR | Recent holders | More sensitive to current price changes |
| LTH-SOPR | Older holders | Reflects longer-term profitability and potential distribution |
| Aggregate SOPR | Broad spent-coin profitability | Overall network-level realized profitability |
This separation allows analysts to understand whether market activity is being driven primarily by newer investors or older holders.
A Simple Example
Imagine Bitcoin is trading at $100,000.
Short-Term Holder
Purchase price: $95,000
Spending price: $100,000
Approximate realized multiple:
100,000 ÷ 95,000 = 1.05
The short-term holder realizes approximately a 5% gain.
Long-Term Holder
Purchase price: $25,000
Spending price: $100,000
Approximate realized multiple:
100,000 ÷ 25,000 = 4.00
The long-term holder realizes approximately a 300% gain relative to the original acquisition value.
Both holders spend Bitcoin at the same market price.
But their profitability is completely different.
This illustrates why cohort analysis can provide information that aggregate SOPR alone may not reveal.
STH-SOPR and Market Recovery
One potentially useful pattern occurs during market recoveries.
After a major decline, short-term holders may initially realize significant losses.
STH-SOPR can remain below 1.
As the market stabilizes, the metric may gradually move toward the break-even level.
If Bitcoin begins forming higher lows and STH-SOPR eventually reclaims 1, this can indicate that recent buyers are returning to profitable conditions.
A simplified recovery pattern can look like:
Deep losses → Stabilization → STH-SOPR improves → Break-even → Profitable spending
When supported by improving demand and price structure, this can provide useful evidence of a strengthening market.
STH-SOPR and Resistance During Recoveries
The 1.0 level can also become important when recent holders are recovering from losses.
Imagine a large group of investors bought Bitcoin near a previous market high.
The price then falls substantially.
Months later, Bitcoin returns to their original acquisition area.
Some investors may decide:
“I finally reached break-even. I want to exit.”
This behavior can produce additional selling pressure around the break-even region.
STH-SOPR can help analysts observe how recently acquired coins behave during this process.
LTH-SOPR and Bull-Market Maturity
Long-term holder profitability can become increasingly relevant as a bull market matures.
Early in a bull market, many long-term holders may remain inactive.
As prices rise substantially, the potential reward for selling becomes increasingly attractive.
Eventually, some older holders may begin realizing gains.
If this behavior becomes persistent while new demand weakens, it can contribute to a distribution environment.
However, strong demand can continue absorbing this supply.
Therefore, LTH-SOPR should be viewed as evidence of long-term holder behavior, not as a guaranteed top indicator.
Combining STH-SOPR and LTH-SOPR
The real analytical power comes from comparing the two cohorts.
Consider three hypothetical scenarios.
Scenario 1 — Strong Bull Market
- STH-SOPR above 1
- LTH-SOPR moderately elevated
- Bitcoin price trending higher
- Strong demand
This can represent healthy profit realization during expansion.
Scenario 2 — Potential Distribution
- LTH-SOPR increasingly elevated
- Older coins becoming more active
- Price momentum weakening
- Demand slowing
This may deserve greater attention as a potential distribution environment.
Scenario 3 — Potential Recovery
- STH-SOPR previously below 1
- Loss realization declining
- STH-SOPR moving toward 1
- Bitcoin establishing stronger price structure
- Demand improving
This can indicate that the newer holder cohort is recovering from a period of stress.
None of these scenarios should be treated as guaranteed outcomes.
Why Holder Cohorts Matter
Bitcoin is not controlled by one homogeneous group of investors.
There are participants who purchased yesterday, investors who entered months ago, and holders who have maintained positions through multiple market cycles.
Their incentives are different.
Their cost bases are different.
Their risk tolerance is different.
Their reactions to price movements are different.
SOPR cohort analysis attempts to capture these differences.
This makes it particularly valuable for understanding who is driving realized profit and loss at different stages of the market cycle.
A Practical Cohort Analysis Checklist
When comparing STH-SOPR and LTH-SOPR, analysts can ask:
- Which cohort is realizing the most profits?
- Which cohort is realizing the most losses?
- Is STH-SOPR above or below 1?
- Is LTH-SOPR increasing or decreasing?
- Are older coins becoming more active?
- Are recent buyers capitulating?
- Is the market absorbing long-term-holder selling?
- Are both cohorts moving toward profitability?
- Is price confirming the same market condition?
- Are other on-chain metrics providing confirmation?
These questions can turn SOPR from a single market-wide number into a much more detailed behavioral framework.
Key Takeaway
Aggregate SOPR tells us about the profitability of spent Bitcoin across the broader network, but holder-specific SOPR metrics can provide a deeper perspective.
STH-SOPR helps analyze the behavior and profitability of newer market participants, who tend to be more sensitive to current price movements.
LTH-SOPR helps examine the behavior of older holders, who may possess substantially larger unrealized gains and can become an important source of supply during mature bull markets.
The relationship between these cohorts can reveal whether a market is experiencing short-term stress, healthy profit-taking, long-term distribution, or improving profitability.
But neither metric should be used alone.
The strongest analysis comes from combining cohort SOPR with Bitcoin price structure, MVRV, realized profit and loss, exchange flows, liquidity, and broader market conditions.
Combining SOPR With Other On-Chain Metrics
SOPR becomes much more useful when it is combined with other on-chain indicators.
A single metric can provide an important piece of information, but Bitcoin’s market structure is too complex to be explained by one number. SOPR tells us about the profitability of spent coins, while other indicators can reveal valuation, unrealized gains, realized dollar profits, holder behavior, and the movement of Bitcoin across the network.
By combining these perspectives, investors can develop a more complete understanding of market-cycle conditions.
The goal is not to create a perfect prediction model.
Instead, the objective is to identify multiple pieces of evidence pointing toward the same market environment.
SOPR and MVRV
One of the most useful combinations is SOPR and MVRV.
MVRV, or Market Value to Realized Value, compares Bitcoin’s market capitalization with its realized capitalization.
In simplified terms:
MVRV = Market Value ÷ Realized Value
While MVRV provides information about the overall valuation of Bitcoin relative to the network’s realized value, SOPR focuses on the profitability of coins that are actually being spent.
This creates an important distinction:
MVRV → Unrealized market profitability and valuation
SOPR → Realized profitability of spent coins
Using both metrics can therefore provide a broader view of market conditions.
Example: Strong Bull Market
Imagine Bitcoin’s price is rising rapidly.
MVRV is increasing because market value is expanding relative to realized value.
At the same time, SOPR remains above 1 because holders are realizing profits.
This combination can indicate a market where:
- Investors have substantial unrealized gains.
- Profitable spending is occurring.
- Demand is still supporting the market.
- Bitcoin remains in a strong expansion phase.
But if valuation becomes increasingly stretched while profit realization intensifies and demand begins weakening, the risk profile can change.
This is where the combination becomes more informative than either metric alone.
SOPR and NUPL
Another useful comparison is SOPR and NUPL.
NUPL, or Net Unrealized Profit/Loss, estimates whether the Bitcoin network is in a state of aggregate unrealized profit or loss.
This creates another complementary relationship:
NUPL → Unrealized profit and loss
SOPR → Realized profit and loss
Imagine Bitcoin has experienced a major rally.
NUPL becomes strongly positive because many holders have substantial unrealized gains.
If SOPR is also consistently above 1, it indicates that profitable holders are actually realizing some of those gains.
This combination can reveal a market where both unrealized profitability and realized profitability are elevated.
That can be normal during a bull market, but extreme conditions may warrant closer monitoring.
SOPR and Realized Profit/Loss
SOPR can also be compared with Realized Profit/Loss.
The two metrics are related but answer different questions.
SOPR focuses on the profitability ratio associated with spent outputs.
Realized Profit/Loss focuses more directly on the aggregate economic value of profits and losses realized by the network.
This distinction is important.
Imagine two markets:
Market A
Many small transactions realize modest profits.
SOPR may remain above 1.
Market B
A smaller number of very large transactions realize substantial profits.
The dollar amount of realized profit could be enormous even if the overall SOPR behavior looks less dramatic.
By combining the two metrics, analysts can better understand both:
The profitability ratio of spending
and
The economic magnitude of realized gains or losses.
SOPR and Exchange Flows
Exchange flows provide another useful layer of information.
When Bitcoin moves to exchanges, analysts often examine whether the transfer could eventually contribute to potential selling pressure.
However, exchange inflows do not automatically mean that Bitcoin will be sold.
Coins can move between exchanges, be used as collateral, or be transferred for other operational reasons.
Therefore, exchange-flow data should also be interpreted carefully.
Combining exchange flows with SOPR can nevertheless provide useful context.
For example:
SOPR elevated + increased exchange inflows + weakening price momentum
This combination may deserve attention because profitable holders could potentially be positioning coins where they can be sold.
But again, this is a risk framework, not proof of future selling.
SOPR and Long-Term Holder Behavior
Long-term holder activity can be particularly valuable when SOPR is elevated.
Suppose Bitcoin has experienced a substantial rally.
Long-term holders have significant unrealized gains.
LTH-SOPR begins showing increased profitable spending.
If Bitcoin continues rising strongly, the market may simply be absorbing long-term-holder profit-taking.
But if long-term-holder spending increases while demand weakens and price momentum deteriorates, the information becomes more significant.
This is why LTH-SOPR + aggregate SOPR + price structure can provide a useful framework for analyzing mature bull markets.
SOPR and Short-Term Holder Behavior
The same principle applies to short-term holders.
Suppose Bitcoin experiences a sharp correction.
STH-SOPR falls below 1 as recent buyers begin realizing losses.
If the price stabilizes and STH-SOPR starts recovering toward 1, the market may be transitioning from stress toward recovery.
Now add other information:
- Bitcoin establishes a higher low.
- Selling volume declines.
- Demand begins improving.
- MVRV stabilizes.
- Realized losses decline.
The combined evidence becomes much stronger than the STH-SOPR recovery alone.
SOPR and Market Cycle Phases
Combining multiple indicators can help create a simplified market-cycle framework.
Phase 1 — Accumulation
Typical characteristics may include:
- Depressed valuations
- Significant realized losses
- SOPR frequently below or near 1
- Reduced speculative activity
- Gradual improvement in demand
The objective is not to identify an exact bottom but to recognize that the market may be moving through a prolonged period of stress and restructuring.
Phase 2 — Recovery
Possible characteristics include:
- SOPR recovering toward 1
- STH-SOPR improving
- Realized losses declining
- MVRV recovering from depressed levels
- Bitcoin establishing stronger price structure
This phase can represent a transition from widespread loss realization toward renewed profitability.
Phase 3 — Expansion
Possible characteristics include:
- SOPR consistently above 1
- Increasing realized profits
- Positive NUPL
- Rising MVRV
- Strong demand
- Higher highs and higher lows
Profit realization can remain healthy during this stage because demand continues absorbing supply.
Phase 4 — Euphoria
Possible characteristics may include:
- Very high unrealized profits
- Elevated MVRV
- Strong realized profit
- Persistent SOPR above 1
- Increasing speculative activity
- Rapid price appreciation
These conditions do not guarantee an immediate top, but they can indicate a market where risk is becoming increasingly asymmetric.
Phase 5 — Distribution
Potential characteristics include:
- Persistent profit realization
- Increased long-term-holder spending
- Weakening demand
- Slowing price momentum
- Elevated valuation
- Increasing market volatility
This is where the combination of SOPR and other indicators can become particularly valuable.
Phase 6 — Capitulation
Potential characteristics include:
- SOPR below 1
- Heavy realized losses
- Weak market sentiment
- Significant price declines
- Short-term-holder stress
- Reduced speculative demand
Capitulation can eventually create the conditions for another accumulation phase, but the transition does not necessarily happen immediately.
A Multi-Metric Example
Consider a hypothetical Bitcoin market trading near a cycle high.
Suppose:
- MVRV is elevated.
- NUPL shows substantial unrealized profits.
- SOPR remains significantly above 1.
- LTH-SOPR indicates increased profitable spending.
- Realized profits are increasing.
- Price momentum begins weakening.
No single indicator proves that a market top has occurred.
But together, these observations tell a much stronger story:
Many holders are profitable + significant profits are being realized + older holders are active + valuation is elevated + price momentum is weakening.
That does not predict the exact top.
It does, however, suggest that investors should pay closer attention to potential distribution and downside risk.
A Multi-Metric Bottom Example
Now consider the opposite situation.
Bitcoin has experienced a prolonged decline.
Suppose:
- SOPR remains below 1.
- Realized losses are elevated.
- STH-SOPR shows significant stress.
- MVRV is depressed.
- NUPL shows widespread unrealized losses or very limited profitability.
- Selling pressure begins declining.
- Bitcoin establishes a stronger price structure.
Again, there is no guarantee that the exact market bottom has been reached.
But the combination suggests that the market may be moving from severe stress toward stabilization.
This is much more useful than saying:
“SOPR is below 1, therefore Bitcoin has bottomed.”
Why Confirmation Matters
On-chain indicators can sometimes send conflicting signals.
For example:
SOPR may show strong profit realization while price continues rising.
That does not necessarily mean the market is topping.
Similarly, SOPR may fall below 1 during a temporary correction while Bitcoin later resumes its uptrend.
This is why confirmation is so important.
A stronger framework asks whether multiple independent measurements are telling a consistent story.
If SOPR, MVRV, NUPL, realized profits, holder behavior, and price structure all begin pointing toward the same market condition, the signal deserves more attention.
Leading vs. Confirming Information
It is also useful to distinguish between indicators that may change early and indicators that provide confirmation.
SOPR can change as holders begin realizing profits or losses.
Price structure may change afterward.
Other indicators may confirm the transition over a longer period.
Therefore, investors should not expect every metric to turn at exactly the same time.
Instead, the objective is to monitor the sequence of changes.
For example:
SOPR weakens → realized losses increase → price stabilizes → STH-SOPR recovers → SOPR reclaims 1 → broader valuation improves
This sequence can provide more information than any individual data point.
Building a Simple SOPR Dashboard
Investors interested in on-chain analysis can create a simple dashboard around SOPR.
Core SOPR Metrics
- Aggregate SOPR
- STH-SOPR
- LTH-SOPR
Profitability Metrics
- MVRV
- NUPL
- Realized Profit/Loss
Market Structure
- Bitcoin price
- Trading volume
- Market momentum
- Support and resistance
Flow Metrics
- Exchange inflows
- Exchange outflows
- Long-term holder transfers
- Stablecoin liquidity
The purpose of such a dashboard is not to generate a single “buy” or “sell” score.
Instead, it creates a multi-dimensional view of Bitcoin’s market condition.
Avoiding Indicator Overload
There is also a danger in using too many indicators.
Adding more metrics does not automatically produce better analysis.
If ten indicators measure essentially the same underlying behavior, the apparent confirmation may be misleading.
A better approach is to select metrics that provide different types of information.
For example:
SOPR → Realized profitability
MVRV → Valuation
NUPL → Unrealized profitability
Exchange flows → Potential liquidity and selling context
Price structure → Market trend
Together, these metrics cover different dimensions of the market.
The Importance of Context
Historical thresholds should also be treated carefully.
A SOPR value that was meaningful during one market cycle may not have exactly the same significance in another.
Bitcoin’s market structure changes.
Institutional participation changes.
Liquidity changes.
The size and composition of the investor base changes.
Derivatives markets evolve.
Therefore, historical patterns should be treated as contextual evidence rather than permanent rules.
A Practical Multi-Metric Framework
When analyzing Bitcoin using SOPR, investors can follow five broad steps.
Step 1: Check SOPR
Determine whether spent coins are being realized at profits or losses.
Step 2: Check Holder Cohorts
Compare short-term and long-term holder behavior.
Step 3: Check Valuation
Use MVRV and related metrics to understand whether the market appears relatively undervalued or highly valued.
Step 4: Check Unrealized Profitability
Use NUPL to understand the broader unrealized profit/loss environment.
Step 5: Confirm With Price and Demand
Finally, compare the on-chain evidence with price structure, liquidity, volume, and demand.
This process can reduce the risk of overreacting to one indicator.
Key Takeaway
SOPR is most powerful when it is treated as one component of a broader on-chain analysis framework.
MVRV provides valuation context.
NUPL provides information about unrealized profitability.
Realized Profit/Loss provides the economic magnitude of gains and losses.
STH-SOPR and LTH-SOPR reveal differences between newer and older holders.
Exchange flows and market structure provide additional context around potential supply and demand.
Together, these indicators can help analysts recognize transitions between accumulation, recovery, expansion, euphoria, distribution, and capitulation.
The objective is not to predict the exact day of a market top or bottom.
Instead, it is to understand whether profitability, valuation, holder behavior, and market structure are becoming increasingly supportive or increasingly fragile.
How to Read SOPR Charts and Avoid Common Mistakes
Understanding the theory behind SOPR is important, but investors ultimately need to know how to read and interpret the metric on a chart.
A SOPR chart can look simple: a line moving above and below the 1.0 level alongside the Bitcoin price.
Yet interpreting those movements correctly requires more than simply looking for a number above or below 1.
The most useful approach is to study direction, persistence, magnitude, market context, and confirmation from other indicators.
SOPR is not designed to provide a guaranteed prediction of the next Bitcoin move. Instead, it helps investors understand the profitability behavior of coins being spent across the network.
Start With the 1.0 Baseline
The first thing to identify on a SOPR chart is the 1.0 level.
This is the approximate break-even point.
A simple framework is:
SOPR > 1.0 → Aggregate profit realization
SOPR = 1.0 → Approximate break-even
SOPR < 1.0 → Aggregate loss realization
This baseline provides the foundation for interpreting almost every SOPR chart.
However, the direction of the metric can sometimes be more informative than its exact position.
For example, SOPR moving from 0.80 to 0.95 tells a different story from SOPR moving from 1.10 to 1.30.
In the first case, profitability is improving even though the metric remains below 1.
In the second case, profitable spending is becoming increasingly elevated.
Look at the Trend, Not One Reading
One of the biggest mistakes investors can make is focusing on a single SOPR reading.
Suppose SOPR suddenly falls below 1 for one day.
That does not automatically mean the Bitcoin market has entered a bear market.
Similarly, a single spike above 1 does not mean a market top is forming.
Instead, examine the broader trend.
Ask:
- Has SOPR remained above 1?
- Has it remained below 1?
- Is it making higher lows?
- Is it making lower highs?
- Is the distance from 1 increasing?
- Is the metric returning toward the baseline?
These questions reveal much more about market behavior.
Pattern 1: Persistent SOPR Above 1
A prolonged period above 1 indicates that spent coins are generally being realized at profits.
This can occur during a healthy bull market.
For example:
SOPR 1.03 → 1.06 → 1.08 → 1.05 → 1.10
The metric remains above the break-even level despite fluctuations.
This suggests that profitable spending remains a persistent feature of the market.
But this does not automatically mean that Bitcoin is near a top.
A strong market can continue rising while holders repeatedly realize profits.
Pattern 2: Persistent SOPR Below 1
The opposite pattern occurs when SOPR remains below 1 for an extended period.
For example:
0.98 → 0.94 → 0.91 → 0.93 → 0.95
This indicates continued aggregate loss realization.
Such a pattern can appear during prolonged market weakness.
The key question becomes:
Is the market becoming weaker, or is loss realization beginning to diminish?
If SOPR starts moving steadily upward from deeply negative levels, the interpretation may change.
Pattern 3: Recovery Toward 1
A gradual recovery toward 1 can be particularly interesting after a prolonged period below the break-even level.
For example:
0.82 → 0.87 → 0.91 → 0.95 → 0.99
The metric remains below 1 throughout much of the move, but profitability conditions are improving.
This can indicate that loss realization is becoming less severe.
If Bitcoin’s price is simultaneously establishing higher lows, the combination may provide evidence of market stabilization.
Still, investors should wait for broader confirmation rather than treating the pattern as a guaranteed bottom signal.
Pattern 4: Reclaiming 1
A stronger development occurs when SOPR moves above 1 after a prolonged period below it.
For example:
0.90 → 0.94 → 0.98 → 1.01 → 1.05
This indicates a transition from aggregate loss realization toward aggregate profit realization.
If the move is sustained and accompanied by improving market structure, it can support the interpretation that market conditions are strengthening.
The key word is sustained.
A brief move above 1 followed by another decline below it can produce a very different interpretation.
Pattern 5: Rejection at 1
SOPR can also repeatedly approach 1 and then fall back below it.
For example:
0.90 → 0.98 → 0.94 → 0.99 → 0.92
This pattern can suggest that the market is struggling to establish sustainable profitable spending.
In a weak market, the 1.0 level can therefore act as an important behavioral threshold.
Recent buyers may sell when prices recover close to their acquisition costs, creating additional supply around break-even.
Repeated failure to reclaim 1 can therefore be worth monitoring.
Pattern 6: Sharp SOPR Spike
A sudden increase in SOPR can indicate an unusually strong burst of profit realization.
For example:
1.05 → 1.08 → 1.25 → 1.10
Such a spike may occur when a large number of profitable coins are spent.
But a spike alone is not enough to declare a market top.
Investors should ask:
- Did Bitcoin price also surge?
- Did the spike last?
- Did long-term holders become more active?
- Did realized profit increase?
- Did demand weaken afterward?
- Did price momentum deteriorate?
The answers provide the context needed to interpret the spike.
Pattern 7: Sharp SOPR Drop
A sudden drop below 1 can indicate increased loss realization.
For example:
0.98 → 0.94 → 0.82
This may occur during a sharp market correction or capitulation event.
But the same caution applies.
A sharp drop does not automatically identify the exact market bottom.
The next phase matters.
If SOPR quickly recovers, the event may have been temporary.
If it remains deeply depressed, the market may still be experiencing significant stress.
Pattern 8: SOPR Divergence
Divergence can sometimes provide additional information.
Imagine Bitcoin’s price reaches a new high while SOPR fails to reach a previous profitability peak.
This may indicate that the relationship between price and realized profitability is changing.
Likewise, Bitcoin could make a new low while SOPR forms a higher low.
Such differences may suggest that selling behavior is changing even though price has not yet fully reflected it.
Divergence should be treated as a secondary analytical tool, not a guaranteed reversal signal.
The strongest divergence analysis combines SOPR with price structure and other on-chain metrics.
Use Multiple Timeframes
Another important consideration is timeframe.
A short-term SOPR chart can show rapid changes in holder behavior.
A longer-term chart can reveal broader market-cycle patterns.
For example:
Short timeframe → Local profit-taking and loss realization
Medium timeframe → Changing market regime
Long timeframe → Broader cycle behavior
Looking at only one timeframe can create misleading conclusions.
A short-term SOPR spike may appear dramatic on a daily chart but become insignificant when viewed across several years.
Conversely, a slow deterioration may not be obvious on a short timeframe but can become important on a long-term chart.
SOPR and Bitcoin Price Should Be Viewed Together
SOPR is most useful when placed alongside Bitcoin’s price chart.
Imagine:
Bitcoin price rising + SOPR above 1
This can indicate healthy profit realization during an uptrend.
Now imagine:
Bitcoin price rising slowly + SOPR increasingly elevated + weakening momentum
This may deserve more attention.
Similarly:
Bitcoin price falling + SOPR below 1
can indicate loss realization.
But:
Bitcoin price stabilizing + SOPR recovering from below 1
can provide evidence that profitability conditions are improving.
The interaction between price and SOPR is more informative than either chart alone.
Common Mistake #1: Treating SOPR as a Perfect Top Indicator
One of the biggest mistakes is assuming:
“SOPR is high, so Bitcoin must be at the top.”
This is incorrect.
Bull markets can maintain elevated SOPR for long periods because holders continue realizing profits while new demand enters the market.
High SOPR indicates profitable spending.
It does not automatically identify the end of the trend.
Common Mistake #2: Treating SOPR Below 1 as a Guaranteed Buy Signal
The opposite mistake is equally dangerous:
“SOPR is below 1, so Bitcoin must have bottomed.”
Loss realization can continue throughout prolonged bear markets.
A market can experience multiple waves of selling before establishing a durable bottom.
Therefore, SOPR below 1 should be interpreted as evidence of loss realization, not as a guaranteed accumulation signal.
Common Mistake #3: Ignoring Holder Cohorts
Aggregate SOPR can hide important differences between investor groups.
A large amount of profitable spending by long-term holders can have a different meaning from losses being realized primarily by recent buyers.
This is why STH-SOPR and LTH-SOPR can add valuable context.
Always consider:
Who is spending the coins?
That question can significantly improve the interpretation.
Common Mistake #4: Ignoring Market Conditions
The same SOPR reading can have different meanings in different environments.
A SOPR reading of 1.10 during a strong bull market may represent ordinary profit-taking.
A similar reading during a highly speculative and weakening market may deserve more attention.
Indicators do not exist in isolation.
The broader market regime matters.
Common Mistake #5: Focusing Only on the Absolute Number
Investors sometimes become overly focused on whether SOPR is 1.05, 1.10, or 1.20.
The exact number is not always the most important information.
Instead, ask:
What is SOPR doing?
Is it rising?
Falling?
Stabilizing?
Returning toward 1?
Repeatedly rejecting 1?
The direction and persistence can provide valuable context.
Common Mistake #6: Ignoring Data Adjustments
SOPR data can be presented using different methodologies and filters.
For example, analysts may encounter:
- Adjusted SOPR
- Entity-adjusted SOPR
- STH-SOPR
- LTH-SOPR
- Different time resolutions
These variations can produce different-looking charts.
Therefore, investors should understand which version of SOPR they are analyzing before comparing values across platforms.
Common Mistake #7: Assuming Every On-Chain Transaction Represents a Market Sale
This is another important limitation.
Bitcoin being moved on-chain does not necessarily mean that someone sold it on an exchange.
Coins can be transferred between wallets, reorganized within custody systems, moved between entities, or used for other purposes.
SOPR is based on the economic relationship between spent outputs and their previous acquisition values.
Therefore, it should not be interpreted as a direct measure of exchange selling volume.
Common Mistake #8: Ignoring Large Transfers
Large transactions can sometimes influence on-chain metrics.
A relatively small number of high-value coin movements can have a meaningful impact on aggregate measurements.
Therefore, unusually large SOPR changes should be investigated rather than immediately interpreted as broad market behavior.
Analysts can compare aggregate metrics with holder cohorts and other on-chain data to determine whether the move appears widespread or concentrated.
Common Mistake #9: Using Historical Patterns as Guaranteed Rules
Bitcoin’s market structure changes over time.
The network has experienced:
- Different levels of institutional participation
- Changing liquidity conditions
- Different investor compositions
- New custody structures
- Expanding derivatives markets
- Changing regulatory environments
As a result, historical SOPR behavior should be treated as evidence and context, not as an unbreakable rule.
History can help us understand possible patterns.
It cannot guarantee that the next cycle will behave exactly the same way.
A Better SOPR Reading Process
A disciplined SOPR analysis can follow a simple sequence.
Step 1 — Find the 1.0 Level
Determine whether spent coins are being realized at aggregate profits or losses.
Step 2 — Identify the Direction
Is SOPR rising, falling, or moving sideways?
Step 3 — Examine Persistence
Has the current condition lasted for days, weeks, or months?
Step 4 — Check Holder Cohorts
Compare aggregate SOPR with STH-SOPR and LTH-SOPR where available.
Step 5 — Compare With Price
Is Bitcoin trending higher, lower, or sideways?
Step 6 — Check Valuation
Look at MVRV and other valuation measures.
Step 7 — Examine Realized Profit/Loss
Determine whether realized gains or losses are becoming increasingly significant.
Step 8 — Look for Confirmation
Use additional evidence before drawing a major conclusion.
This process helps transform SOPR from a simple chart into a structured analytical framework.
A Simple Decision Matrix
| SOPR Condition | Bitcoin Price | Possible Interpretation |
|---|---|---|
| Above 1 and rising | Strong uptrend | Profit realization during expansion |
| Above 1 and persistent | Strong uptrend | Healthy profitable spending may be occurring |
| Above 1 and weakening | Price momentum slowing | Monitor potential distribution |
| Below 1 and falling | Sharp downtrend | Increasing loss realization |
| Below 1 but rising | Price stabilizing | Loss realization may be easing |
| Reclaims 1 | Recovery | Improving profitability conditions |
| Repeatedly rejects 1 | Weak market | Break-even selling pressure may persist |
These are interpretive frameworks, not trading rules.
The Importance of Confirmation
A strong SOPR analysis should ideally have several independent confirmations.
For example, a potential market-top environment might involve:
Elevated SOPR + high MVRV + increasing realized profits + long-term-holder distribution + weakening price momentum
A potential recovery environment might involve:
SOPR below 1 followed by recovery + declining realized losses + improving STH-SOPR + stronger price structure + recovering valuation
The more independent evidence points toward the same conclusion, the more useful the analysis becomes.
SOPR Is Best Used as a Context Tool
The most effective way to use SOPR is not to ask:
“What will Bitcoin do next?”
Instead, ask:
“What are Bitcoin holders doing right now, and how profitable are the coins being spent?”
This shift in perspective is important.
SOPR provides evidence about realized behavior.
It does not eliminate uncertainty.
It does not predict unexpected news.
It does not know future liquidity conditions.
And it cannot account for every factor influencing Bitcoin’s price.
Its strength is providing an additional layer of evidence that traditional price charts cannot directly show.
Key Takeaway
Reading SOPR effectively requires more than checking whether the metric is above or below 1.
Investors should examine:
- Direction
- Persistence
- Magnitude
- The 1.0 threshold
- Holder cohorts
- Bitcoin’s price structure
- Market valuation
- Realized profit and loss
- Broader market conditions
The biggest mistake is treating SOPR as a mechanical buy-or-sell indicator.
A high SOPR does not guarantee a market top.
A low SOPR does not guarantee a market bottom.
Instead, SOPR becomes valuable when it helps investors understand whether profitable or loss-making behavior is becoming stronger, weaker, or more persistent.
When combined with MVRV, NUPL, realized profit/loss, STH-SOPR, LTH-SOPR, price action, and other on-chain metrics, it can become a powerful tool for understanding Bitcoin’s market-cycle dynamics.
A Practical SOPR Framework for Bitcoin Investors
Understanding SOPR is useful, but the real value comes from knowing how to apply it without treating a single reading as a guaranteed market signal. SOPR works best as part of a broader on-chain framework that combines holder behavior, market valuation, realized profit and loss, price structure, and overall market conditions.
The goal is not to ask, “Is SOPR bullish or bearish?”
A better question is:
“What is SOPR telling us about the behavior of Bitcoin holders right now, and does the rest of the market data confirm that interpretation?”
This approach can help investors recognize changes in market psychology while avoiding many of the common mistakes associated with on-chain indicators.
1. Start With the Market Timeframe
Before interpreting SOPR, determine what type of market movement you are analyzing.
There is a major difference between:
- A short-term Bitcoin correction
- A multi-week consolidation
- A developing bull market
- A late-stage bull market
- A prolonged bear market
- A potential long-term market bottom
The same SOPR behavior can have different meanings depending on the surrounding environment.
For example, SOPR briefly falling below 1 during a strong uptrend could represent short-term holders realizing losses during a normal correction. The same behavior during a prolonged bear market could indicate deeper market weakness.
Context comes first.
2. Check the 1.0 SOPR Baseline
The 1.0 level remains one of the simplest and most useful reference points.
SOPR Above 1
Coins being spent are, on average, being realized at a profit.
This can indicate:
- Profit-taking
- Healthy realization of gains
- Strong market conditions
- Increasing holder confidence
- Potential distribution when readings become persistently elevated
SOPR Near 1
The market is close to aggregate break-even on spent coins.
This can indicate:
- A consolidation phase
- A transition between market conditions
- Support or resistance around realized profitability
- Reduced conviction among some participants
SOPR Below 1
Coins being spent are, on average, being realized at a loss.
This can indicate:
- Fear
- Capitulation
- Forced selling
- Weak market conditions
- Loss realization during corrections
However, none of these conditions should automatically be interpreted as a buy or sell signal.
3. Examine the Trend Instead of One Reading
One of the most important SOPR lessons is:
Trend and persistence generally matter more than a single spike or dip.
Consider two hypothetical situations.
Scenario A
SOPR falls slightly below 1 for one day and quickly returns above it.
This may simply represent temporary stress.
Scenario B
SOPR remains below 1 for an extended period while Bitcoin continues declining and investors repeatedly realize losses.
This provides much stronger evidence of persistent market weakness.
The same principle applies to bullish conditions.
A single SOPR spike above 1 does not necessarily mean the market has reached a top. Persistent elevated profitability combined with weakening price structure and increasing distribution can provide a much more meaningful warning.
4. Compare Short-Term and Long-Term Holders
Aggregate SOPR becomes more informative when it is separated into holder cohorts.
Short-term holders generally respond more quickly to price changes because their acquisition prices are relatively recent.
Long-term holders, on the other hand, may have significantly different cost bases and unrealized gains.
This creates an important distinction.
If STH-SOPR is weak
Recent buyers may be under pressure.
If LTH-SOPR becomes increasingly elevated
Older holders may be realizing substantial profits.
If both cohorts show strong profitability
The broader market may be experiencing widespread profit realization.
If both cohorts experience persistent losses
The market may be undergoing significant stress.
Looking at the cohorts separately can therefore help explain who is actually driving the observed SOPR behavior.
5. Combine SOPR With MVRV
SOPR and MVRV measure different aspects of profitability.
SOPR focuses on realized profitability when coins are spent.
MVRV compares market value with realized value and therefore provides information about unrealized market profitability.
Together, they can provide a stronger picture.
For example:
SOPR rising + MVRV rising
This can indicate expanding profitability and strengthening market conditions.
SOPR elevated + MVRV elevated
This may indicate a highly profitable environment where profit-taking deserves closer attention.
SOPR below 1 + MVRV falling
This can indicate broadening market stress and declining investor profitability.
SOPR recovering + MVRV stabilizing
This may suggest that selling pressure is weakening and market conditions are beginning to improve.
Again, these are frameworks for interpretation—not guaranteed market predictions.
6. Add NUPL and Realized Profit/Loss
NUPL can help provide another perspective on whether the market is operating in profit or loss territory.
Realized Profit/Loss focuses more directly on the economic gains or losses actually being realized through spent coins.
This creates a useful three-part framework:
SOPR → What is happening when coins are spent?
NUPL → How profitable is the broader network on an unrealized basis?
Realized Profit/Loss → How much profit or loss is actually being realized?
When these metrics move in the same direction, the market signal can become more convincing.
When they disagree, investors should slow down and investigate why.
7. Add Price Structure and Market Liquidity
On-chain metrics should not be analyzed in isolation from the actual market.
Price action can help determine whether SOPR behavior is occurring during:
- A breakout
- A correction
- A range
- A failed rally
- A major support test
- A breakdown
- A recovery
Liquidity is also important.
A market experiencing large changes in liquidity, leverage or trading volume may behave differently from a quiet market.
For example, an increase in SOPR during a strong price breakout may reflect healthy profit realization.
The same increase near a major resistance level, combined with weakening momentum and heavy distribution, may deserve greater attention.
8. A Six-Phase SOPR Market-Cycle Framework
SOPR can be organized into a practical market-cycle framework.
| Market Phase | Typical SOPR Behavior | Possible Interpretation |
|---|---|---|
| Accumulation | Weak or recovering from below 1 | Loss realization may be exhausting |
| Recovery | Gradual movement toward/above 1 | Profitability is improving |
| Expansion | Sustained readings above 1 | Profitable spending and stronger confidence |
| Euphoria | Elevated profitability and increased realization | Profit-taking and distribution risk may increase |
| Distribution | Profit realization remains strong while price momentum weakens | Potential late-cycle warning |
| Capitulation | Persistent readings below 1 | Heavy loss realization and market stress |
This table should not be treated as a rigid formula.
Bitcoin does not move through every market phase in exactly the same way every cycle.
The purpose of the framework is to organize evidence rather than predict the future with certainty.
9. Identifying Potential Market-Top Risk
A stronger top-risk framework can be built by looking for several conditions occurring together.
Condition 1: SOPR remains elevated
Profit realization is strong.
Condition 2: Long-term holders increasingly realize profits
Older investors may be distributing some of their holdings.
Condition 3: MVRV becomes historically elevated
Unrealized profitability becomes increasingly large.
Condition 4: Realized profit increases significantly
More investors are converting paper gains into realized gains.
Condition 5: Price momentum weakens
Bitcoin continues rising, but momentum begins to deteriorate.
Condition 6: Distribution becomes more visible
Large holders or profitable cohorts increasingly move coins.
When several of these conditions appear together, the probability of a meaningful correction or distribution phase may deserve greater attention.
But even then, SOPR cannot identify the exact day or price of a market top.
10. Identifying Potential Market-Bottom Conditions
The same framework can be reversed.
Potential bottoming conditions may include:
- SOPR remaining below 1
- Persistent loss realization
- Extreme investor pessimism
- Weakening selling pressure
- Declining realized losses
- MVRV moving toward historically depressed levels
- NUPL showing significant compression
- Price stabilizing after a major decline
- SOPR beginning to recover toward 1
- SOPR eventually reclaiming 1
The important distinction is between capitulation and recovery.
A very low SOPR reading can demonstrate that investors are realizing losses, but it does not prove that the bottom has already formed.
A more constructive development can occur when loss realization begins to decline and SOPR starts establishing a recovery.
11. The “SOPR Evidence, Not Instruction” Rule
One of the best rules for using SOPR is simple:
Use SOPR as evidence, not as an instruction.
A SOPR reading should not automatically tell an investor:
- Buy Bitcoin
- Sell Bitcoin
- Open a short
- Close a position
- Expect a new all-time high
- Expect an immediate crash
Instead, SOPR should contribute one piece of evidence to a broader decision-making process.
For example:
SOPR says: holders are realizing increasing profits.
Then ask:
- Is Bitcoin near a major resistance level?
- Is MVRV elevated?
- Are long-term holders distributing?
- Is realized profit increasing?
- Is momentum weakening?
- Are exchange inflows increasing?
- Is market liquidity changing?
Only after examining the broader evidence can investors develop a more reliable interpretation.
12. A Practical SOPR Checklist
Before making a market interpretation based on SOPR, ask these questions:
SOPR Checklist
1. Where is SOPR relative to 1.0?
Above, below, or around break-even?
2. Is the movement persistent?
One reading or a multi-day/multi-week trend?
3. Is SOPR rising or falling?
Direction can matter more than the absolute reading.
4. Which holders are responsible?
Are short-term or long-term holders driving the behavior?
5. What is MVRV showing?
Is overall market profitability expanding or contracting?
6. What is NUPL showing?
Is unrealized profitability strengthening or weakening?
7. What is realized profit/loss showing?
Are investors realizing increasing gains or losses?
8. What is Bitcoin’s price doing?
Trending, consolidating, breaking out, or breaking down?
9. What are exchange flows showing?
Are coins moving toward or away from exchanges?
10. Is there confirmation from multiple indicators?
If only SOPR is signaling something unusual, caution is appropriate.
13. Major Limitations of SOPR
SOPR is powerful, but it is not perfect.
Understanding its limitations is just as important as understanding its strengths.
SOPR Does Not Track Every Investor
SOPR analyzes spent outputs. It does not directly measure the behavior of every Bitcoin holder who continues to hold their coins.
Someone sitting on a large unrealized profit does not influence SOPR until their coins are spent.
On-Chain Movement Is Not Always a Market Sale
Coins can move between wallets for many reasons.
A transfer does not necessarily mean that an investor sold Bitcoin on an exchange.
Therefore, SOPR should not be interpreted as a direct measurement of exchange selling volume.
Large Transactions Can Influence Aggregate Readings
Very large transactions can affect aggregate metrics.
This is one reason cohort-based analysis can sometimes provide additional clarity.
Different Providers Can Use Different Methodologies
SOPR variants and data providers may differ in their calculation methods, cohort definitions, filters, or presentation.
Investors should understand what version of SOPR they are viewing before comparing values across platforms.
Historical Thresholds Are Not Permanent Rules
A level that appeared important during one Bitcoin cycle may not have exactly the same significance during another.
Market structure changes.
Investor composition changes.
Liquidity changes.
Institutional participation changes.
Therefore, historical behavior should be treated as context rather than a guaranteed template.
SOPR Is Primarily Descriptive
SOPR tells us about realized profitability associated with spent coins.
It does not know what will happen tomorrow.
It cannot directly predict:
- Central-bank decisions
- Regulatory announcements
- Geopolitical shocks
- Exchange failures
- Unexpected liquidity changes
- New institutional demand
- Sudden changes in investor sentiment
This is why SOPR works best as part of a broader analytical framework.
14. Building a Simple SOPR Dashboard
Investors who regularly study Bitcoin on-chain analytics do not need dozens of indicators.
A relatively simple dashboard can include:
Holder Profitability
- SOPR
- STH-SOPR
- LTH-SOPR
Market Valuation
- MVRV
- NUPL
Realized Activity
- Realized Profit
- Realized Loss
- Realized Cap
Market Flows
- Exchange inflows
- Exchange outflows
- Stablecoin liquidity
Market Structure
- Bitcoin price
- Trading volume
- Major support and resistance
- Market momentum
The objective is not to collect as many indicators as possible.
The objective is to determine whether multiple independent pieces of evidence are telling a similar story.
15. A Simple Decision Framework
A practical approach can be summarized in five stages:
Stage 1 — Observe
Look at SOPR without immediately assigning a bullish or bearish label.
Stage 2 — Identify the Trend
Determine whether profitability is increasing, decreasing, or stabilizing.
Stage 3 — Identify the Participants
Separate short-term and long-term holder behavior.
Stage 4 — Confirm
Compare SOPR with MVRV, NUPL, realized profit/loss, exchange flows, and price structure.
Stage 5 — Evaluate Risk
Ask whether the evidence points toward:
- Strength
- Healthy correction
- Distribution
- Capitulation
- Recovery
- Uncertainty
This process is much more robust than reacting to a single number.
Final Takeaway: What SOPR Really Tells Bitcoin Investors
SOPR is one of the most useful on-chain metrics for understanding realized holder profitability.
Its greatest strength is not that it can predict the exact top or bottom of Bitcoin.
Its strength is that it helps investors observe what happens when holders actually spend their coins.
When SOPR is above 1, profitable spending dominates on average.
When SOPR falls below 1, loss realization dominates on average.
When SOPR repeatedly interacts with the 1.0 level, the behavior of market participants can provide valuable information about changing market conditions.
But the most important insight comes from combining SOPR with holder cohorts, MVRV, NUPL, realized profit/loss, exchange flows, and price structure.
At potential market tops, persistent profit realization combined with elevated valuation and weakening momentum can increase distribution concerns.
At potential market bottoms, prolonged loss realization followed by declining selling pressure and a recovery in SOPR can provide evidence that market conditions are improving.
Still, no single metric can eliminate uncertainty.
SOPR should therefore be viewed as a market-behavior lens—not a crystal ball.
For Bitcoin investors, the most valuable approach is to watch the direction, persistence, holder cohorts, and confirmation from other indicators rather than reacting to one isolated reading.
Ultimately, SOPR answers an important question:
Are Bitcoin holders realizing profits or losses when they spend their coins—and how is that behavior changing throughout the market cycle?
Understanding that behavior can give investors a deeper perspective on Bitcoin’s transition between accumulation, recovery, expansion, euphoria, distribution, and capitulation.
And that is where SOPR becomes most powerful—not as a standalone prediction tool, but as one important piece of a broader on-chain market analysis framework.