
Introduction
Cryptocurrency markets generate an enormous amount of information every day. Investors can study price charts, trading volume, technical indicators, market sentiment, derivatives data, macroeconomic conditions, and news headlines to understand where digital assets may be heading. But one of the most distinctive sources of information in crypto exists directly beneath the market: the blockchain itself.
This is where on-chain analytics becomes important.
Unlike traditional financial markets, many public blockchain networks provide a transparent record of transactions, token movements, wallet activity, and other forms of network behavior. This data can be analyzed to understand how assets are moving, how actively networks are being used, and how investors may be positioning themselves.
On-chain analytics therefore adds another layer to cryptocurrency research. Instead of looking only at the price of Bitcoin or Ethereum, investors can investigate what is happening behind that price. For more information about Bitcoin and its underlying technology, readers can explore Bitcoin.org.
Are coins moving into exchanges or away from them?
Are more addresses interacting with the network?
Are holders sitting on large unrealized profits?
Are investors realizing gains or losses when they move their assets?
Are large holders accumulating or distributing their positions?
These questions cannot always be answered by a conventional price chart. Blockchain data can provide additional evidence that helps investors understand market behavior.
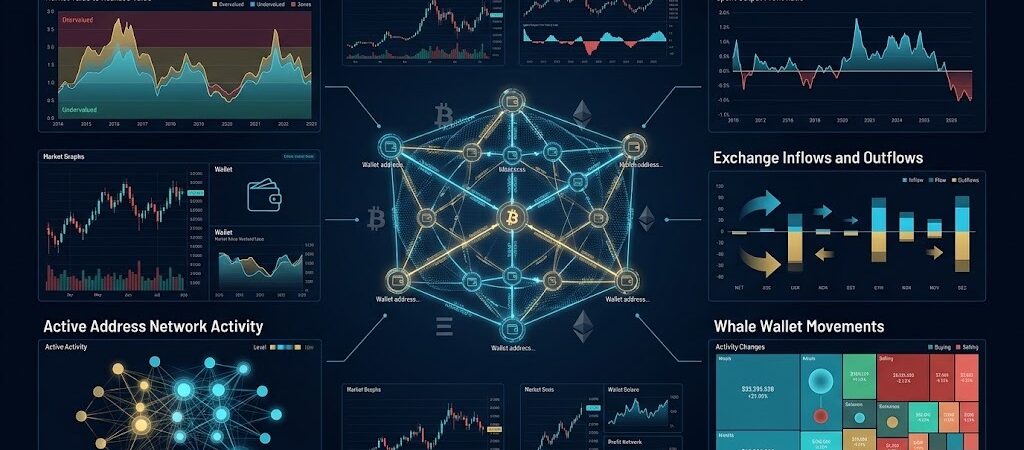
Current on-chain research commonly groups metrics into areas such as valuation, profit and loss, exchange flows, supply distribution, and network activity. Among the most widely discussed measures are MVRV, SOPR, exchange flows, active addresses, and whale or large-holder activity.
However, on-chain analytics should not be treated as a crystal ball.
A large transfer does not automatically mean a price crash is coming. An increase in active addresses does not guarantee that an asset will appreciate. Exchange outflows do not necessarily prove that every investor is accumulating for the long term.
The real value comes from interpreting multiple signals together.
This article examines five important on-chain metrics that crypto investors can monitor to develop a deeper understanding of blockchain markets. The goal is not simply to define the metrics, but to explain what each one can reveal, how investors can interpret changes, and why context matters when using blockchain data for investment research.
What Is On-Chain Analytics?
On-chain analytics is the process of analyzing data recorded directly on a blockchain to understand network activity, asset movements, investor behavior, and market conditions.
Public blockchains continuously generate data. Every transaction, transfer, address interaction, and token movement contributes to a growing ledger that can be analyzed using specialized blockchain analytics platforms and data tools.
For investors, this creates a unique research opportunity.
Traditional financial markets often require investors to rely on information provided by exchanges, companies, financial institutions, regulators, or other intermediaries. Public blockchains can provide a different model because transaction information is recorded on a distributed ledger that can be independently verified.
On-chain analysis uses that information to construct measurable indicators.
For example, rather than simply observing that Bitcoin’s price has increased, an investor could examine whether older Bitcoin holders are moving coins, whether exchange balances are changing, whether network activity is expanding, or whether holders are realizing profits.
These additional observations can help create a more complete picture of market conditions.
On-Chain Data vs. Price Data
Price data tells investors what the market is currently pricing an asset at.
On-chain data can help explain what is happening with the underlying blockchain activity and asset movements.
Consider a hypothetical situation in which Bitcoin rises sharply over several weeks.
A price chart can show:
- Bitcoin’s percentage increase
- Trading volume
- Volatility
- Support and resistance levels
- Moving averages
- Momentum indicators
On-chain analytics can add another perspective:
- Whether coins are moving toward or away from exchanges
- Whether long-term holders are increasing or reducing exposure
- Whether more addresses are becoming active
- Whether investors are realizing profits
- Whether large wallets are changing their holdings
- Whether the network’s economic activity is expanding
Neither dataset is automatically superior.
Instead, they answer different questions.
Technical analysis primarily studies market behavior through price and volume, while on-chain analytics studies activity recorded on the blockchain.
Combining both approaches can provide stronger context than relying exclusively on either one.
Why On-Chain Analytics Matters for Crypto Investors
The cryptocurrency market is particularly suited to on-chain analysis because many major networks operate through transparent public ledgers.
This transparency creates data that traditional investors may not have in the same form.
For example, Bitcoin’s blockchain records transactions and transfers between addresses. Ethereum and other smart-contract platforms also record a wide range of activity involving transactions, token movements, decentralized applications, and smart contracts.
Analysts can transform this raw blockchain information into metrics that are easier to interpret.
These metrics can help answer several important questions.
1. What Are Investors Doing?
Price alone does not reveal whether investors are accumulating, distributing, transferring, or simply holding assets.
On-chain metrics can provide clues about these behaviors.
For example, sustained movement of assets away from centralized exchanges may indicate that some holders are transferring assets into self-custody. However, analysts still need to consider the reason for the movement because blockchain transfers can have multiple explanations.
2. Is the Network Being Used?
Active addresses and transaction activity can help investors evaluate whether blockchain usage is expanding or contracting.
Growing network activity may indicate increased participation, although active-address figures should not automatically be interpreted as a direct measure of unique human users.
One individual or organization can control multiple addresses, while exchanges and applications can generate significant transaction activity.
Therefore, network activity is useful, but it requires context.
3. Are Holders in Profit or Loss?
Metrics such as MVRV and SOPR attempt to measure the profit and loss position of market participants.
MVRV compares market value with realized value, while SOPR examines whether transferred coins are generally being moved at a profit or loss.
These measures can help investors identify periods of elevated profitability, stress, capitulation, or changing market behavior.
4. Where Is Supply Moving?
Exchange flows are another important component of on-chain research.
When assets move onto exchanges, they may become more readily available for trading or selling. When assets leave exchanges, they may be moving toward self-custody or other destinations.
However, the interpretation is not always straightforward.
Large transfers can represent internal exchange movements, custody changes, institutional operations, or other activities that do not necessarily represent immediate buying or selling.
This is why professional analysis generally focuses on patterns and persistence rather than a single blockchain transaction.
5. What Are Large Holders Doing?
Whale activity can attract significant attention because large holders control substantial amounts of certain digital assets.
Tracking large-wallet movements can provide additional information about supply concentration and potential market positioning.
But the word “whale” should be used carefully.
A large wallet does not necessarily belong to an individual investor. It could belong to an exchange, custodian, institution, protocol, foundation, or other entity.
Consequently, wallet labeling and address clustering are important when interpreting whale data.
How On-Chain Analytics Works
At its foundation, on-chain analytics begins with raw blockchain information.
The process can be simplified into several stages:
Blockchain → Raw Data → Data Processing → Metrics → Interpretation → Investment Context
First, blockchain transactions and state information are collected.
Next, analytics providers process this information and classify addresses, transactions, transfers, balances, and other relevant data points.
Those datasets are then transformed into metrics such as MVRV, SOPR, exchange netflows, active addresses, and whale activity.
Finally, analysts interpret the metrics alongside price, market structure, macroeconomic conditions, derivatives positioning, and other information.
This final step is critical.
A metric by itself is simply a measurement.
Its investment value depends on how it is interpreted in context.
The Difference Between On-Chain Analytics and Technical Analysis
Technical analysis and on-chain analytics can complement one another, but they are not the same.
Technical analysis generally examines historical market data such as:
- Price
- Trading volume
- Moving averages
- RSI
- MACD
- Support and resistance
- Candlestick patterns
- Market structure
On-chain analytics examines blockchain-native information such as:
- Wallet activity
- Token transfers
- Exchange flows
- Realized capitalization
- Holder profitability
- Address activity
- Supply distribution
For example, technical analysis might identify Bitcoin breaking above a major resistance level.
On-chain analysis could then be used to investigate whether the breakout is accompanied by changing holder behavior, exchange flows, or network activity.
When several independent data sources point in the same direction, investor conviction may become stronger.
When they disagree, the disagreement itself can be informative.
The Five Key Metrics Covered in This Guide
This article focuses on five major areas of on-chain analysis:
1. MVRV Ratio
The Market Value to Realized Value (MVRV) ratio is an important on-chain analytics metric that compares a cryptocurrency’s market capitalization with its realized capitalization.
It helps investors evaluate whether the market value of an asset is relatively high or low compared with the aggregate value represented by previous on-chain transaction prices.
MVRV is particularly useful when studied across historical market cycles. Rather than treating one reading as a guaranteed buy or sell signal, investors can use MVRV to identify periods of relatively high or low market valuation and compare those conditions with other on-chain metrics.
For a broader understanding of how blockchain transparency supports institutional analysis, see our guide to Proof of Reserves vs. Regulatory Audits.
2. SOPR
The Spent Output Profit Ratio (SOPR) is another important on-chain analytics metric that examines whether coins being moved on the blockchain are generally being realized at a profit or at a loss.
SOPR provides insight into realized investor behavior, rather than simply measuring unrealized gains or losses.
A SOPR value above 1 generally indicates that transferred coins are being realized at an aggregate profit, while a value below 1 generally indicates aggregate realized losses, depending on the methodology used by the analytics provider.
Investors can study SOPR alongside MVRV, exchange flows, active addresses, and whale activity to develop a more complete picture of cryptocurrency market conditions. For investors combining on-chain data with chart-based analysis, Bitcoin technical analysis can provide an additional perspective on market trends and price behavior.
3. Exchange Flows
Exchange inflows and outflows monitor the movement of assets between blockchain addresses associated with exchanges and other addresses.
The direction, size, persistence, and destination of these flows can provide clues about potential changes in available trading supply.
For institutional investors, understanding how digital assets move between exchanges, wallets, and custody infrastructure is also important. Institutional-grade digital asset custody provides additional context for understanding how professionally managed crypto assets may be stored and transferred.
4. Active Addresses
As blockchain ecosystems expand, network activity can also shift between mainnets and scaling solutions. Layer 2 ecosystems can process activity away from a base blockchain while remaining connected to its broader infrastructure, making them an important part of understanding modern blockchain usage.
5. Whale Activity
Whale analysis focuses on large holders and significant transactions.
It can help investors study supply concentration, large-holder movements, and potential distribution or accumulation patterns.
Together, these five metrics cover several important dimensions of the crypto market: valuation, realized behavior, supply movement, network activity, and large-holder positioning.
Why No Single Metric Is Enough
One of the biggest mistakes investors can make with on-chain analytics is treating one indicator as a guaranteed trading signal.
Markets are complex.
An asset can experience large exchange outflows while its price declines. A network can record increasing active addresses while the token price remains weak. MVRV can enter an elevated zone without an immediate market reversal.
This happens because every metric captures only one part of the market.
A better approach is to look for confluence.
For example:
MVRV elevated + increased profit realization + rising exchange inflows
could suggest a market environment where investors should pay closer attention to potential distribution.
By contrast:
Lower valuation + reduced selling pressure + declining exchange balances
could provide evidence consistent with accumulation, although it still would not guarantee a price increase.
The objective is not to find a perfect indicator.
The objective is to build a framework that combines several pieces of evidence.
The Growing Role of On-Chain Analytics in Crypto Research
As the cryptocurrency market matures, blockchain data is becoming increasingly important for investors who want to move beyond basic price analysis.
Institutional investors, professional traders, researchers, and crypto-focused funds can use on-chain datasets as part of broader market intelligence systems.
The growing availability of specialized analytics platforms also means that investors no longer need to manually inspect raw blockchain transactions to obtain useful information.
Modern tools can organize blockchain data into dashboards, charts, alerts, and historical datasets.
This makes complex blockchain information more accessible.
However, accessibility should not be confused with certainty.
More data does not automatically produce better investment decisions.
The important skill is knowing which metrics matter, what they actually measure, and how to interpret them without overestimating their predictive power.
That is the foundation of effective on-chain analytics.
MVRV Ratio: Understanding Market Value vs. Realized Value
Among the many indicators used in on-chain analytics, the Market Value to Realized Value (MVRV) Ratio is one of the most useful metrics for understanding the relationship between an asset’s current market valuation and the value at which coins were previously moved on the blockchain.
Rather than looking only at the current market price, MVRV attempts to provide a broader picture of the aggregate profit or loss position of holders.
This makes it particularly useful when investors are trying to understand whether market participants are sitting on relatively large unrealized gains or losses.
What Is the MVRV Ratio?
MVRV stands for Market Value to Realized Value.
The basic formula is:
MVRV = Market Value ÷ Realized Value
Market value is generally represented by the cryptocurrency’s market capitalization based on its current market price.
Realized value, by contrast, attempts to value coins according to the price at which they were last moved on-chain.
This creates an important distinction.
Traditional market capitalization asks:
“What are all these coins worth at today’s market price?”
Realized capitalization asks:
“What was the approximate value of these coins based on the prices at which they last moved?”
MVRV compares these two concepts.
When the market value is significantly higher than realized value, the aggregate market may contain substantial unrealized gains.
When market value is closer to or below realized value, the aggregate profit position may be much smaller or may indicate that many holders are underwater.
Why MVRV Matters for Investors
MVRV can help investors understand the broader profitability environment of a cryptocurrency.
Suppose an asset has experienced a major price increase over an extended period.
Many holders may have acquired their coins at significantly lower prices. If those coins have not moved since then, their current market value can be considerably higher than their estimated realized value.
MVRV can therefore rise.
This does not automatically mean that the market must crash.
Instead, it suggests that the market contains a larger amount of unrealized value relative to the historical on-chain cost basis represented by realized capitalization.
That information can become more meaningful when combined with other metrics.
For example, an elevated MVRV reading accompanied by strong profit realization, rising exchange inflows, and increased selling pressure may deserve more attention than an elevated MVRV reading alone.
This is a central principle of effective on-chain analytics:
A metric provides evidence, not certainty.
How MVRV Is Calculated
At a simplified level, the calculation can be represented as:
MVRV = Current Market Capitalization / Realized Capitalization
For example, imagine a hypothetical cryptocurrency with:
- Market capitalization: $800 billion
- Realized capitalization: $400 billion
The simplified MVRV would be:
$800 billion ÷ $400 billion = 2.0
An MVRV of 2.0 means that the market value is approximately twice the realized value under this simplified framework.
It does not mean that every investor has doubled their money.
The metric is an aggregate measurement, and individual investors can have dramatically different entry prices.
This distinction is important because on-chain metrics are often misunderstood when they are treated as if they describe every holder equally.
What a High MVRV Can Indicate
A relatively high MVRV may indicate that market participants, in aggregate, are holding substantial unrealized gains.
Historically, periods of very elevated profitability have sometimes coincided with increased market risk because profitable holders may have greater incentives to realize gains.
However, markets can remain at elevated valuation levels for extended periods.
Therefore, investors should avoid interpreting a high MVRV as an automatic sell signal.
A better interpretation is:
Higher MVRV can indicate a market environment in which unrealized profitability is elevated and profit-taking risk may deserve closer monitoring.
This distinction makes the metric much more useful.
What a Low MVRV Can Indicate
A relatively low MVRV may indicate that the market’s current valuation is closer to the aggregate realized value.
In periods of severe market weakness, MVRV can decline substantially as prices fall and the gap between market value and realized value narrows.
When MVRV becomes very low, some investors may interpret the market as being closer to historically depressed valuation conditions.
Again, this does not guarantee that a bottom has formed.
An asset can remain undervalued for an extended period, and MVRV can remain low while prices continue to experience volatility.
Therefore, low MVRV should be viewed as a valuation-context signal, not a guaranteed buying opportunity.
MVRV and Market Cycles
One reason MVRV receives significant attention in crypto research is its potential usefulness across different market-cycle environments.
During strong bull markets, rising prices can push market value substantially above realized value.
As the cycle matures, increasing numbers of holders may have significant unrealized gains.
Eventually, some investors may begin realizing those gains.
During bear markets, falling prices can reduce the market value component while realized capitalization changes more gradually.
The resulting compression in MVRV can provide information about the changing profitability environment.
This makes MVRV particularly interesting when studied over long historical periods.
Instead of asking:
“Is today’s MVRV high or low?”
Investors can ask:
“How does today’s MVRV compare with previous market conditions for this particular asset?”
Historical context is essential.
Different cryptocurrencies can have very different supply structures, investor bases, issuance models, and on-chain behavior.
A threshold that appears meaningful for Bitcoin should not automatically be applied to every altcoin.
MVRV Z-Score
Investors may also encounter a related indicator known as the MVRV Z-Score.
The MVRV Z-Score attempts to standardize the difference between market value and realized value relative to historical volatility.
A simplified conceptual representation is:
MVRV Z-Score = (Market Value − Realized Value) ÷ Standard Deviation
The purpose is to make unusually large differences between market value and realized value easier to identify within historical data.
This can be useful when studying long-term market cycles.
However, investors should understand that the MVRV Z-Score is a derived indicator rather than an independent source of information.
Its interpretation depends on the underlying market-value and realized-value data.
MVRV for Bitcoin and Other Assets
MVRV is particularly well known in Bitcoin on-chain analysis because Bitcoin’s transparent blockchain provides a large historical dataset for studying realized capitalization.
Researchers have used realized-value concepts to investigate long-term Bitcoin market behavior.
However, MVRV-style analysis can also be applied to other blockchain assets where appropriate data is available.
The interpretation may become more complicated for tokens with:
- High issuance rates
- Frequent token migrations
- Large foundation holdings
- Significant treasury balances
- Complex staking structures
- Extensive smart-contract activity
- Wrapped or bridged versions
- Highly concentrated ownership
These factors can affect how realized-value models should be interpreted.
For this reason, investors should always understand the methodology behind an analytics provider’s data before comparing MVRV readings across different assets.
MVRV Does Not Predict Exact Tops or Bottoms
One of the most important lessons for investors is that MVRV should not be treated as a precise market-timing tool.
Suppose MVRV reaches a level that historically appeared near previous market peaks.
That does not mean the price must immediately reverse.
Markets are influenced by liquidity, monetary policy, institutional demand, leverage, investor sentiment, technological developments, regulation, and many other factors.
Likewise, a depressed MVRV does not guarantee that prices cannot fall further.
The strongest use of MVRV is therefore to provide context around market valuation and holder profitability.
It can help investors recognize when market conditions deserve greater attention.
Combining MVRV With Other On-Chain Metrics
MVRV becomes significantly more useful when combined with other blockchain indicators.
For example, investors could monitor:
MVRV + SOPR
This combination can help compare unrealized profitability with realized profit-taking behavior.
MVRV + Exchange Flows
This can provide additional context about whether profitable holders may be moving assets toward trading venues.
MVRV + Active Addresses
This can help compare valuation conditions with broader network activity.
MVRV + Whale Activity
This can provide another perspective on whether large holders are changing their positions during periods of elevated or depressed valuation.
This multi-metric approach is one of the most important principles in on-chain analytics.
Rather than searching for a single “magic number,” investors can build a broader evidence-based framework.
Practical Example
Imagine Bitcoin has experienced a rapid rally over several months.
Its market capitalization has increased substantially, while realized capitalization has grown more slowly.
As a result, MVRV rises.
At the same time:
- SOPR begins showing increased profit realization.
- Exchange inflows begin increasing.
- Large holders transfer more coins toward exchange-linked addresses.
- Price momentum starts weakening.
No single signal proves that a market top has formed.
But together, these observations could indicate that investors should become more cautious and monitor the market closely.
Now consider the opposite scenario.
Bitcoin has experienced a prolonged decline.
MVRV has fallen substantially, profit realization has decreased, and selling pressure appears exhausted.
If exchange outflows begin strengthening and large holders appear to accumulate, the combination could provide evidence of changing market conditions.
Again, this is not a guaranteed bottom signal.
It is a confluence of evidence.
Limitations of MVRV
MVRV has several limitations that investors should understand.
Data Interpretation
Realized capitalization depends on assumptions about how blockchain movements are interpreted and how coins are valued when they move.
Different analytics providers may use different methodologies.
Lost Coins
Coins that are permanently lost can complicate realized-value calculations.
A Bitcoin that has not moved for many years may have a very different economic meaning from an actively held Bitcoin, even though blockchain data cannot always determine the owner’s intentions.
Exchange and Custody Structures
Large exchanges, custodians, and institutions can control substantial numbers of addresses.
Address clustering and entity identification can therefore affect the interpretation of on-chain data.
Different Assets Behave Differently
MVRV should not be interpreted using a universal threshold across every cryptocurrency.
Each asset has its own tokenomics, liquidity, holder structure, and history.
No Guaranteed Prediction
Most importantly, MVRV does not predict the future with certainty.
It is a contextual valuation metric.
How Investors Can Use MVRV Responsibly
A practical framework can be simple:
Step 1: Check the current MVRV level.
Understand whether aggregate market profitability appears relatively high, moderate, or low.
Step 2: Compare it with historical conditions.
Look at previous market environments for the same asset.
Step 3: Check profit realization.
Use SOPR and related metrics to determine whether holders are actively realizing gains or losses.
Step 4: Examine exchange flows.
Determine whether assets are moving toward or away from trading venues.
Step 5: Examine large-holder behavior.
Look for meaningful changes in whale or institutional wallet activity.
Step 6: Confirm with market structure.
Use price action, volume, volatility, and broader macroeconomic conditions.
This approach reduces the risk of making an investment decision based on one isolated metric.
Key Takeaway
The MVRV Ratio is one of the most useful metrics in on-chain analytics because it provides a framework for comparing an asset’s current market valuation with its estimated realized value.
A rising MVRV can indicate increasing aggregate unrealized profitability, while a declining MVRV can indicate compression in that profitability.
But the metric should never be interpreted as a guaranteed top or bottom indicator.
Its real strength comes from historical comparison, contextual analysis, and combination with other on-chain metrics.
For crypto investors, MVRV can therefore serve as an important valuation lens—but it is only one part of the larger on-chain picture.
SOPR: Measuring Realized Profit and Loss
The Spent Output Profit Ratio (SOPR) is another important metric used in on-chain analytics. While MVRV focuses primarily on the relationship between market value and realized value, SOPR looks at what happens when previously held coins are actually spent or transferred.
This distinction makes SOPR particularly valuable for understanding realized investor behavior.
Investors can hold significant unrealized profits for months or years without selling. A market may therefore appear highly profitable on paper while relatively few holders are actually taking those profits.
SOPR attempts to capture what happens when coins move.
By studying whether transferred coins are generally moving at a profit or loss, investors can gain additional insight into market sentiment, selling behavior, and potential changes in market structure.
What Is SOPR?
SOPR stands for Spent Output Profit Ratio.
At a simplified level, SOPR compares the value of coins when they are spent with the value of those same coins when they previously entered their current on-chain position.
Conceptually:
SOPR = Value of Spent Output at Current Price ÷ Value of Spent Output at Previous Acquisition Price
A SOPR value above 1 generally indicates that coins being spent are, in aggregate, realizing profits.
A value below 1 generally indicates that coins being spent are, in aggregate, realizing losses.
A value around 1 suggests that the transferred coins are being spent at approximately their acquisition value.
The metric therefore provides a window into realized profitability.
Why SOPR Matters
One of the biggest challenges in cryptocurrency analysis is distinguishing between unrealized profits and realized profits.
Suppose Bitcoin rises from $40,000 to $80,000.
A holder who purchased Bitcoin at $40,000 is sitting on an unrealized gain of approximately 100%.
But that gain does not become a realized profit until the holder spends or sells the asset.
SOPR is designed to observe this type of realized activity.
This can help investors answer an important question:
Are holders actually taking profits or losses, or are they simply holding their positions?
That information can complement valuation metrics such as MVRV.
How to Interpret SOPR Above 1
When SOPR remains above 1, coins moving on-chain are generally being transferred at a profit.
This can happen during bullish market conditions when many holders have accumulated assets at lower prices.
However, a high or rising SOPR does not automatically mean that the market is becoming bearish.
Profit realization can occur throughout a healthy bull market.
The key question is what happens next.
If profit-taking remains manageable while demand continues to absorb the selling pressure, the market can potentially continue higher.
If profit realization becomes increasingly aggressive while new demand weakens, the market may become more vulnerable to a correction.
Therefore, SOPR is best interpreted as a measure of realized behavior, not a simple buy-or-sell indicator.
How to Interpret SOPR Below 1
When SOPR falls below 1, coins being spent are generally being transferred at a loss.
This can occur during periods of market stress.
For example, after a major price decline, holders who purchased near previous highs may sell at significantly lower prices.
This behavior can contribute to capitulation.
Repeated SOPR readings below 1 can therefore indicate that investors are realizing losses.
But, again, context matters.
A single period below 1 does not automatically mean that the market has reached its bottom.
Prices can continue declining while investors repeatedly realize losses.
SOPR Around 1
A SOPR value near 1 can be especially interesting.
It may indicate that holders are transferring coins around their aggregate acquisition cost.
Depending on the broader market environment, the 1.0 level can sometimes function as a reference point for investor behavior.
During strong markets, SOPR may repeatedly move above 1 as profitable holders take gains.
During weak markets, SOPR may struggle to remain above 1 because holders are more frequently realizing losses.
For this reason, analysts often observe how SOPR behaves around the 1.0 level over time, rather than focusing on a single reading.
SOPR and Market Psychology
SOPR can provide an interesting connection between blockchain activity and investor psychology.
Consider a strong bull market.
Bitcoin rises significantly.
Early investors have large unrealized profits.
As prices continue rising, some investors begin taking profits.
SOPR moves above 1.
If demand remains strong, the market may absorb that profit-taking and continue higher.
Now consider a prolonged bear market.
Prices fall below the acquisition prices of many holders.
Some investors sell to reduce losses.
SOPR moves below 1.
If fear spreads throughout the market, more holders may capitulate.
This relationship between price movement and realized behavior is one reason SOPR is valuable within a broader on-chain analytics framework.
SOPR and Capitulation
Capitulation occurs when investors sell assets under significant emotional or financial pressure, often after a prolonged decline.
During capitulation events, large numbers of holders may realize losses.
SOPR can therefore become deeply depressed during severe market stress.
However, investors should avoid assuming that every low SOPR reading represents a final market bottom.
Capitulation can happen more than once during a bear market.
A market can experience an initial wave of selling, recover temporarily, and then undergo another period of forced or emotional selling.
Therefore, SOPR should be combined with:
- Price structure
- Trading volume
- Exchange flows
- MVRV
- Realized capitalization
- Market liquidity
- Derivatives positioning
- Broader economic conditions
The more independent evidence supports the same conclusion, the more informative the analysis can become.
SOPR vs. MVRV
MVRV and SOPR are related but measure different aspects of profitability.
MVRV focuses on unrealized market profitability.
SOPR focuses on realized profitability when coins are spent.
This difference is important.
Imagine that MVRV is high, indicating that many holders have substantial unrealized gains.
If SOPR remains close to 1, relatively little of that profitability may be getting realized.
Alternatively, if MVRV is high and SOPR begins rising significantly above 1, holders may be actively realizing some of those gains.
This combination can provide more information than either metric alone.
A Simple Example
Imagine an investor buys Bitcoin at $50,000.
Later, Bitcoin rises to $75,000.
If the investor transfers the Bitcoin to another address or spends it in a transaction where the relevant acquisition price is $50,000, the movement could represent a realized gain.
The simplified profit ratio would be:
$75,000 ÷ $50,000 = 1.50
This corresponds to a 1.50 SOPR-style profit ratio for that particular output.
Of course, the actual calculation across a blockchain involves aggregating many spent outputs and applying specific methodology.
The example simply illustrates the underlying concept.
Adjusted SOPR
Investors may also encounter Adjusted SOPR, sometimes referred to as a version designed to reduce the influence of certain types of short-lived or economically less meaningful transfers.
The exact methodology can vary depending on the analytics provider.
This matters because not every blockchain movement represents a meaningful change in investor ownership.
For example, some assets may move between addresses controlled by the same entity.
Short-term transactions can also create noise.
Adjusted versions attempt to provide a cleaner representation of economically meaningful behavior.
Investors should therefore check the methodology behind the specific SOPR dataset they are using.
Short-Term Holder SOPR
Another commonly discussed variation is Short-Term Holder SOPR.
Short-term holder metrics focus on coins that have been held for relatively short periods.
This can provide additional insight into the behavior of newer market participants.
Short-term holders can react more quickly to price movements than long-term holders.
During a strong rally, short-term holders may realize profits as prices rise.
During a sharp decline, they may be more likely to sell at a loss because they have less historical conviction or less tolerance for volatility.
Studying short-term holder behavior can therefore help analysts distinguish between recent investor activity and the behavior of long-term holders.
Long-Term Holder Behavior
Long-term holders can behave differently from short-term participants.
Investors who acquired assets years earlier may have substantially different cost bases and risk tolerance.
Their selling activity can therefore have a different market impact.
When long-term holders begin realizing large profits after an extended bull market, analysts may pay closer attention to the behavior.
Similarly, when long-term holders remain relatively inactive during market weakness, it may indicate that a portion of the supply is being held by investors with stronger conviction.
SOPR should therefore be interpreted alongside holder-age and supply-distribution metrics whenever possible.
SOPR During Bull Markets
During bullish market conditions, SOPR can remain above 1 for extended periods.
This does not necessarily indicate that a reversal is imminent.
Healthy bull markets can contain repeated waves of profit-taking.
The key question is whether the market can absorb that realized supply.
If buyers continue entering the market, profit-taking may simply redistribute coins from older holders to newer participants.
This is why a rising SOPR should not automatically be interpreted as bearish.
Instead, analysts should monitor whether realized profit-taking is becoming unusually large relative to market demand.
SOPR During Bear Markets
During bearish conditions, SOPR may repeatedly struggle to maintain values above 1.
Investors who bought at higher prices can become increasingly willing to realize losses as the market deteriorates.
This can create a cycle of selling pressure and declining confidence.
However, as the market matures through a prolonged downturn, the number of holders with large unrealized losses can eventually change.
New buyers may accumulate at lower prices, creating a different cost-basis structure.
SOPR can therefore evolve as ownership changes throughout a market cycle.
How Investors Can Use SOPR
A practical approach is to monitor several characteristics rather than simply checking whether SOPR is above or below 1.
Direction
Is SOPR rising, falling, or remaining stable?
Persistence
Is a particular behavior lasting for one day or several weeks?
Magnitude
Are realized profits or losses relatively small or unusually large?
Market Context
Is the market bullish, bearish, or range-bound?
Holder Type
Are short-term or long-term holders driving the observed behavior?
Confirmation
Do MVRV, exchange flows, whale activity, and price structure support the same interpretation?
This framework helps prevent overreaction to isolated blockchain data.
Common Mistakes When Using SOPR
Mistake 1: Treating SOPR as a Guaranteed Signal
SOPR does not predict future prices with certainty.
Mistake 2: Ignoring Time Frames
A daily spike can have a very different meaning from a persistent multi-week trend.
Mistake 3: Ignoring Market Structure
SOPR should be interpreted alongside price action and broader market conditions.
Mistake 4: Assuming Every Transfer Is a Sale
Blockchain transfers do not necessarily represent market selling.
Coins can move between wallets, custodians, exchanges, and other entities for many reasons.
Mistake 5: Ignoring Methodology
Different analytics providers may calculate and classify SOPR-related data differently.
Understanding the underlying methodology is essential.
Combining SOPR With Other Metrics
SOPR becomes especially powerful when it is combined with other on-chain indicators.
SOPR + MVRV
This combination compares realized profitability with broader unrealized profitability.
SOPR + Exchange Flows
This can help investors examine whether realized profit-taking is occurring alongside increased movement toward exchanges.
SOPR + Whale Activity
Large-holder transactions can provide additional context around significant changes in realized profitability.
SOPR + Active Addresses
Network activity can help determine whether changing realized profitability is occurring alongside broader blockchain usage.
No combination guarantees a correct market prediction, but multiple independent signals can create a more robust analytical framework.
Key Takeaway
SOPR is a valuable on-chain analytics metric because it focuses on realized profit and loss rather than simply measuring unrealized gains.
A SOPR reading above 1 generally indicates that transferred coins are being realized at a profit, while a reading below 1 generally indicates realized losses.
Its greatest value comes from studying direction, persistence, magnitude, holder behavior, and broader market context.
When combined with MVRV, exchange flows, active addresses, and whale activity, SOPR can help investors develop a much deeper understanding of what blockchain participants are actually doing.
Exchange Inflows and Outflows: Tracking Where Crypto Is Moving
The movement of cryptocurrency between wallets and centralized exchanges is one of the most closely watched areas of on-chain analytics.
Unlike traditional financial markets, public blockchains allow analysts to observe many asset transfers directly on-chain. When blockchain addresses associated with exchanges receive or send large amounts of cryptocurrency, those movements can provide useful information about changes in the location and potential availability of market supply.
This makes exchange inflows and outflows an important metric for crypto investors.
However, interpreting exchange flows correctly requires caution.
A transfer to an exchange does not automatically mean that an investor is preparing to sell. Likewise, a withdrawal from an exchange does not automatically prove that an investor is accumulating for the long term.
The most useful approach is to study direction, size, persistence, destination, market conditions, and supporting metrics together.
What Are Exchange Inflows?
An exchange inflow occurs when cryptocurrency moves from an external blockchain address into an address associated with a cryptocurrency exchange.
For example, a Bitcoin holder may transfer BTC from a personal wallet to a centralized exchange.
Once the assets arrive at the exchange, they may become available for trading, depending on how the exchange and account structure operate.
This is why analysts sometimes monitor rising exchange inflows as a potential indicator of increased trading or selling availability.
But the movement itself does not reveal the owner’s intention.
The investor could be:
- Preparing to sell
- Preparing to trade
- Moving funds for custody reasons
- Rebalancing a portfolio
- Using an exchange service
- Participating in an institutional transaction
- Moving assets between exchange-controlled wallets
Therefore, exchange inflows should be treated as contextual evidence rather than proof of future selling.
What Are Exchange Outflows?
An exchange outflow occurs when cryptocurrency moves from an exchange-associated address to another blockchain address.
This may indicate that assets are being transferred away from a trading venue.
Potential destinations include:
- Personal wallets
- Institutional custody
- Long-term storage
- DeFi applications
- Staking platforms
- Other exchanges
- Custodial services
Because there are many possible destinations, an outflow does not automatically mean that an investor intends to hold the asset indefinitely.
Nevertheless, sustained exchange outflows can be useful when evaluating changes in the amount of an asset held on trading venues.
Why Exchange Balances Matter
Investors often monitor exchange balances alongside individual inflow and outflow transactions.
Exchange balance refers broadly to the amount of a cryptocurrency believed to be held by addresses associated with exchanges.
If exchange balances decline over an extended period, the immediately available supply on those platforms may also decline.
If balances rise, more assets may be sitting within exchange-associated addresses.
The important word is may.
Blockchain data cannot always identify the economic purpose of every transfer.
Exchange address labeling can also be incomplete or change over time.
Therefore, exchange balance data should be interpreted as an analytical estimate rather than an exact representation of every coin available for immediate sale.
Exchange Netflows
One useful way to simplify exchange-flow analysis is through netflows.
A simplified formula is:
Exchange Netflow = Exchange Inflows − Exchange Outflows
If inflows exceed outflows, the netflow is positive.
If outflows exceed inflows, the netflow is negative.
For example:
- Inflows: 20,000 BTC
- Outflows: 15,000 BTC
- Netflow: +5,000 BTC
In this simplified example, more BTC entered exchange-associated addresses than left them during the measurement period.
Conversely:
- Inflows: 15,000 BTC
- Outflows: 20,000 BTC
- Netflow: −5,000 BTC
This indicates that more BTC left exchange-associated addresses than entered them.
Netflow can therefore provide a convenient way to monitor changes in exchange-related asset movement.
Why Positive Netflows Can Attract Attention
Positive exchange netflows can sometimes attract attention because they may indicate that more assets are moving toward exchanges.
If the assets are transferred there for the purpose of selling, this could increase potential sell-side supply.
However, this interpretation is not guaranteed.
Large deposits may occur for reasons unrelated to immediate selling.
For example, an institution could move assets to an exchange to execute a trade, a market maker could rebalance inventory, or an exchange could reorganize its wallet infrastructure.
This is why professional on-chain analytics generally avoids interpreting a single large deposit as a definitive bearish signal.
Instead, analysts examine whether a persistent pattern is developing.
Why Negative Netflows Can Attract Attention
Negative exchange netflows occur when outflows exceed inflows.
Some investors interpret sustained negative netflows as potentially consistent with accumulation or movement toward longer-term custody.
Again, this interpretation requires caution.
Assets can leave one exchange and move to another exchange-controlled address.
A user can also withdraw assets for DeFi activity, collateral management, staking, or other purposes.
Therefore, negative netflow should not automatically be interpreted as proof of long-term accumulation.
The Importance of Persistent Trends
One of the most important principles in exchange-flow analysis is persistence.
A single large transaction may have little meaning.
A sustained trend lasting days or weeks can be more informative.
Imagine that an exchange records a very large Bitcoin inflow on Monday.
That transaction could be caused by:
- A large investor
- An institutional transfer
- Internal exchange operations
- Custody restructuring
- A market maker
- A treasury movement
Without additional information, it is difficult to determine the exact reason.
Now imagine that multiple exchange addresses experience consistently elevated inflows over several weeks while price is rising rapidly and realized profits are increasing.
That broader pattern deserves significantly more attention.
The goal of on-chain analytics is therefore not to react to every transaction.
It is to identify meaningful behavioral patterns within large datasets.
Exchange Flows During Bull Markets
During bull markets, exchange inflows can increase simply because more participants are actively trading.
Rising prices can encourage profitable holders to transfer assets to exchanges and realize gains.
At the same time, strong demand can absorb that selling pressure.
This means increasing inflows do not necessarily end a bull market.
In fact, healthy markets can experience substantial profit-taking while continuing to rise.
Investors should therefore compare exchange-flow data with:
- Price momentum
- SOPR
- MVRV
- Trading volume
- Stablecoin liquidity
- Whale activity
- Derivatives positioning
The combination provides a more complete picture.
Exchange Flows During Bear Markets
During bear markets, exchange inflows can sometimes increase as investors become concerned about further losses.
Holders may move assets toward exchanges because they want to reduce exposure.
Large inflows combined with declining prices and elevated realized losses may therefore indicate increased selling pressure.
However, the opposite can also occur.
If exchange balances decline during a prolonged bear market, it may indicate that some investors are moving assets into self-custody or longer-term storage.
This can potentially reduce the amount of immediately exchange-held supply.
Again, it does not guarantee a market recovery.
Exchange Flows and Stablecoins
Exchange-flow analysis is not limited to Bitcoin and Ethereum.
Stablecoins are particularly important because they can represent available liquidity within the crypto ecosystem.
When stablecoins move onto exchanges, they may become available for trading or other activities.
An increase in exchange-held stablecoins can therefore be relevant when studying potential purchasing liquidity.
However, stablecoin movements can also be associated with:
- Payments
- Arbitrage
- Market making
- DeFi
- Treasury management
- Cross-exchange transfers
- Settlement activity
Therefore, stablecoin exchange flows also require contextual analysis.
Bitcoin Exchange Flows
Bitcoin exchange flows are among the most widely followed datasets in cryptocurrency research.
Analysts can study:
- BTC deposits to exchanges
- BTC withdrawals
- Exchange balances
- Large BTC transfers
- Long-term changes in exchange-held supply
- Inflows relative to historical averages
- Outflows relative to historical averages
These metrics can help investors evaluate potential changes in liquid supply.
For example, a prolonged decline in exchange-held Bitcoin can be consistent with a shift toward self-custody or long-term holding.
But the data should always be considered alongside wallet labeling and broader market behavior.
Ethereum Exchange Flows
Ethereum exchange flows can provide additional complexity because ETH is not only a tradable asset but also an important component of the Ethereum ecosystem.
ETH may be moved for:
- Trading
- Staking
- DeFi
- Liquidity provision
- Collateral
- Layer-2 activity
- Wallet management
As a result, an ETH withdrawal from an exchange does not necessarily mean that the holder intends to simply store the asset.
The purpose of the transfer matters.
This demonstrates why on-chain analytics should be adapted to the characteristics of each blockchain.
Large Exchange Transfers
Large transactions often attract significant attention on social media.
A headline may announce:
“A whale moved millions of dollars of Bitcoin to an exchange.”
Such information can be interesting, but investors should avoid making immediate decisions based solely on it.
First, determine:
Who controls the address?
Second:
Is the destination actually an exchange?
Third:
Is the transaction part of a larger series of transfers?
Fourth:
Has the asset actually been sold?
Fifth:
What are the broader market conditions?
A deposit does not equal a sale.
This distinction is essential.
Exchange Flows and Whale Analysis
Exchange flows become more informative when combined with whale activity.
Suppose a large holder transfers a substantial amount of BTC to an exchange.
That event could potentially indicate increased selling risk.
But if the same whale later moves the BTC back to another wallet, the initial interpretation may change.
Similarly, if many large holders independently move assets toward exchanges while SOPR rises and MVRV becomes elevated, the combined evidence may deserve greater attention.
This is an example of multi-metric confirmation.
Exchange Flows and SOPR
Combining exchange flows with SOPR can help investors examine whether profitable transfers are occurring alongside increased movement toward exchanges.
Consider a hypothetical situation:
- SOPR rises significantly above 1.
- Exchange inflows increase.
- Bitcoin price is near a major multi-month high.
- Large-holder deposits increase.
This combination may suggest that some market participants are realizing profits.
But it still does not guarantee that a market top is imminent.
The information simply increases the importance of monitoring the market.
Exchange Flows and MVRV
MVRV can provide valuation context.
Suppose MVRV is relatively elevated, indicating substantial unrealized profitability.
If exchange inflows simultaneously increase, investors may pay closer attention to potential profit-taking.
Conversely, if MVRV is depressed and exchange balances are declining, the market may be entering a different type of supply environment.
The important point is that valuation and asset location answer different questions.
MVRV asks:
How profitable is the market relative to realized value?
Exchange flows ask:
Where are assets moving, particularly in relation to exchange-associated addresses?
Together, they provide a richer perspective.
Exchange Inflows Do Not Equal Selling
This is perhaps the most important warning in this section.
A cryptocurrency deposited into an exchange is not automatically sold.
The asset could remain in the exchange account.
It could be traded for another asset.
It could be used as collateral.
It could be transferred internally.
It could be associated with institutional settlement.
Therefore:
Exchange inflow ≠ confirmed selling
Likewise:
Exchange outflow ≠ confirmed accumulation
These distinctions protect investors from overinterpreting blockchain data.
Common Mistakes in Exchange-Flow Analysis
Mistake 1: Reacting to One Transaction
Large transactions can be visually impressive but economically insignificant.
Mistake 2: Ignoring Internal Transfers
Exchanges can move assets between their own addresses.
Mistake 3: Assuming Every Deposit Is a Sale
Deposits indicate movement toward an exchange, not necessarily execution of a sell order.
Mistake 4: Ignoring Wallet Labels
Incorrect or outdated address labeling can lead to misleading conclusions.
Mistake 5: Ignoring Time Frames
A one-day spike can mean something very different from a persistent multi-week trend.
Mistake 6: Ignoring Market Context
Exchange-flow data should be considered alongside price, liquidity, investor profitability, and network activity.
A Practical Exchange-Flow Framework
Crypto investors can use a simple framework when evaluating exchange movements.
Step 1: Identify the direction.
Are inflows or outflows dominating?
Step 2: Measure the size.
Is the movement unusually large relative to historical activity?
Step 3: Check persistence.
Is the trend continuing?
Step 4: Examine the addresses.
Are they known exchange, institutional, whale, or other entity addresses?
Step 5: Compare with price.
Is the movement occurring during a rally, correction, or consolidation?
Step 6: Compare with MVRV and SOPR.
Are holders simultaneously sitting on large profits or realizing gains?
Step 7: Check whale behavior.
Are large holders participating in the same direction?
This process can transform raw transaction information into a more useful analytical framework.
The Role of Exchange Data in Institutional Crypto Research
As institutional participation in digital assets expands, exchange-flow analysis can become increasingly relevant.
Professional investors may combine blockchain data with:
- Custody information
- Exchange liquidity
- Derivatives markets
- ETF flows
- Macroeconomic indicators
- Stablecoin supply
- Trading volume
- Order-book data
The goal is to create a broader market intelligence system.
On-chain analytics is particularly valuable because it provides a perspective that traditional market data may not capture.
However, professional investors also recognize that blockchain transparency has limitations.
Not every address can be confidently identified.
Not every transfer reveals its purpose.
And not every movement translates directly into market buying or selling.
Key Takeaway
Exchange inflows and outflows are essential components of on-chain analytics because they help investors monitor where crypto assets are moving and how exchange-held supply may be changing.
Positive netflows can indicate that more assets are moving toward exchanges, while negative netflows indicate that more assets are leaving exchange-associated addresses.
But these movements should never be treated as automatic buy or sell signals.
The most reliable interpretation comes from examining persistent trends, address identity, transaction size, market conditions, MVRV, SOPR, whale activity, and network behavior together.
Active Addresses and Network Activity: Measuring Blockchain Usage
The fourth major metric in this guide to on-chain analytics is active addresses and broader network activity.
While MVRV helps investors study valuation, SOPR examines realized profit and loss, and exchange flows track the movement of assets around trading venues, active-address metrics focus on a different question:
How actively is the blockchain being used?
A blockchain can have a valuable token, but its long-term economic significance also depends on whether people, applications, businesses, and other participants are actually using the network.
Active addresses can provide one useful perspective on this activity.
However, like every on-chain metric, active addresses must be interpreted carefully. A growing number of active addresses does not automatically mean that a cryptocurrency’s price will rise. Similarly, declining activity does not necessarily mean that a network is failing.
The most useful approach is to examine active addresses alongside transaction activity, fees, economic value transferred, application usage, token supply, and market conditions.
What Are Active Addresses?
An active address is generally a blockchain address that participates in a transaction during a specified period.
Depending on the blockchain and analytics provider, the exact methodology can differ.
For example, a dashboard might report:
- Daily active addresses
- Weekly active addresses
- Monthly active addresses
- Active sending addresses
- Active receiving addresses
- New addresses
- Returning addresses
These measurements can help analysts understand how much participation is occurring on a blockchain.
The key point is that an active address is not necessarily equivalent to a unique human user.
One person can control multiple addresses.
An exchange can control thousands or millions of addresses.
A decentralized application can also generate large amounts of address activity.
Therefore, active-address data should be viewed as a measurement of blockchain address activity, not a perfect measurement of human adoption.
Why Active Addresses Matter
Network activity can provide important context for cryptocurrency investors.
Suppose the price of a blockchain’s native asset increases significantly.
An investor may naturally ask:
“Is this price growth happening alongside stronger network usage?”
Active addresses can provide one piece of that answer.
If address activity is expanding alongside transactions, fees, and application usage, the combination may suggest that economic activity on the network is becoming stronger.
If price rises while network activity remains stagnant, investors may want to investigate why.
Neither situation guarantees a particular price outcome.
The purpose is to understand whether market valuation and underlying network activity are moving together or diverging.
Active Addresses vs. New Addresses
These two metrics are related but different.
Active addresses measure addresses participating in transactions during a particular period.
New addresses generally measure addresses appearing or becoming active for the first time according to the methodology used by the analytics provider.
A network can have:
- High active addresses but few new addresses
- Many new addresses but relatively low total activity
- Both high active and new addresses
- Declining activity across both measures
Each scenario can tell a different story.
For example, a network with high active addresses but limited growth in new addresses may have a strong existing user base but slower expansion.
A network experiencing strong growth in new addresses may be attracting new participants.
However, address creation can also be automated or associated with exchanges and applications, so it should not be treated as a direct user-growth measurement.
Daily Active Addresses
Daily active addresses are commonly used to monitor short-term network activity.
A sudden increase may occur because of:
- Increased trading
- A new application launch
- Token activity
- NFT activity
- Airdrops
- Network upgrades
- Market speculation
- Increased transaction demand
The reason behind the increase matters.
For example, an address spike caused by a temporary token distribution may have very different economic significance from sustained growth in organic application activity.
This is why investors should investigate the source of the activity rather than simply celebrating a larger number.
Long-Term Trends Are More Important Than Single-Day Spikes
One of the biggest mistakes investors make with network activity is focusing on short-term spikes.
Imagine that a blockchain records a 50% increase in active addresses on one day.
That sounds impressive.
But if activity returns to normal the following day, the event may have little long-term significance.
Now imagine active addresses increase gradually over six months.
That trend may provide more meaningful evidence of expanding participation.
Therefore, investors should consider:
- Daily activity
- Weekly averages
- Monthly trends
- Year-over-year changes
- Historical cycles
Longer time frames can reduce the noise associated with temporary blockchain events.
Transaction Count and Active Addresses
Active addresses become more informative when combined with transaction counts.
Transaction count measures the number of transactions processed during a particular period.
Suppose active addresses rise while transaction counts also increase.
This could suggest broader participation and higher network usage.
However, if transaction counts increase dramatically while active addresses remain unchanged, it could indicate that existing addresses are becoming much more active.
Again, neither interpretation is automatically bullish or bearish.
The objective is to understand what type of activity is increasing.
Transaction Volume
Another important metric is transaction volume.
Transaction volume measures the amount of value transferred through the network according to the methodology of the data provider.
A network may have:
- High address activity
- High transaction count
- Low economic value transferred
Or:
- Low address activity
- Low transaction count
- Very high value transferred
These different structures can occur because blockchain users have different transaction behaviors.
For example, a small number of institutional or high-value participants can generate enormous transfer volumes without creating millions of active addresses.
This is why active addresses should not be viewed in isolation.
Network Fees
Network fees provide another important layer of information.
When demand for blockchain block space increases, fees can rise depending on the network’s architecture and fee mechanism.
Strong activity accompanied by increasing fees can indicate that users are competing for limited network resources.
However, high fees can also create negative consequences.
If fees become excessively expensive, some users and applications may move to other networks or scaling solutions.
Therefore, investors should distinguish between:
Healthy demand for block space
and
Congestion that reduces usability.
This distinction is particularly important when evaluating smart-contract networks.
Ethereum and Active Addresses
Ethereum provides a useful example of why network activity can be complicated.
Ethereum supports:
- Token transfers
- Decentralized exchanges
- Lending protocols
- Stablecoins
- NFTs
- Staking
- Smart contracts
- Layer-2 ecosystems
As a result, activity can originate from many different sources.
An increase in Ethereum address activity could therefore be associated with trading, DeFi, stablecoins, gaming, NFTs, infrastructure, or other applications.
Investors should identify the source of the activity whenever possible.
A broad increase across multiple application categories may be more meaningful than a temporary spike caused by a single speculative event.
Bitcoin and Active Addresses
Bitcoin’s activity structure is different.
Bitcoin is primarily used for:
- Value transfer
- Settlement
- Savings
- Long-term holding
- Payments
- Institutional transfers
Bitcoin address activity can therefore behave differently from smart-contract networks.
Large institutional transfers can generate significant transaction value without creating a proportionate increase in the number of active addresses.
Similarly, changes in wallet management practices can affect address metrics.
This demonstrates why the same on-chain metric should not be interpreted identically across every blockchain.
Active Addresses and Adoption
Active-address growth is sometimes described as evidence of blockchain adoption.
There is some logic behind this interpretation.
If more addresses are participating in network activity over an extended period, the network is clearly experiencing greater address-level activity.
But investors should be precise.
Active addresses do not equal users.
One user may control many addresses.
One organization may control a large number of addresses.
Automated systems can also create substantial activity.
Therefore, active addresses should be considered one adoption indicator among many.
Other useful measures can include:
- Transaction activity
- Fee generation
- Economic value transferred
- Stablecoin activity
- DeFi usage
- Developer activity
- Application usage
- Token holder distribution
- Revenue generated by protocols
A strong network thesis is more convincing when multiple indicators support it.
Active Addresses and Token Valuation
Network activity can sometimes help investors evaluate whether a token’s valuation is supported by underlying usage.
Suppose two blockchain networks have similar market capitalizations.
Network A has:
- Rising active addresses
- Growing transaction activity
- Increasing application usage
- Expanding fee generation
Network B has:
- Declining active addresses
- Falling transaction activity
- Limited application usage
- Weak fee generation
The two assets may deserve different levels of investor attention.
However, valuation should never be based on active addresses alone.
Token supply, inflation, revenue distribution, competition, decentralization, liquidity, and market expectations also matter.
Address Activity and Sybil Behavior
Another important limitation is Sybil activity.
A Sybil participant can control many addresses to make network activity appear larger than it really is.
This can happen around:
- Airdrops
- Incentive programs
- Token launches
- Governance campaigns
- NFT launches
- Blockchain rewards
If thousands of addresses are created solely to qualify for an incentive, the resulting address activity may not represent sustainable adoption.
This is why sophisticated on-chain analytics attempts to distinguish between different types of address behavior.
Exchange Addresses Can Distort Activity
Centralized exchanges can control very large numbers of blockchain addresses.
When exchanges reorganize funds, move customer assets, or process large transaction batches, active-address metrics can be affected.
For example, a major operational change at an exchange could produce unusual address activity without representing a sudden increase in individual users.
This is another reason why investors should examine entity-adjusted data where available.
Active Addresses and Network Health
Network activity can be particularly useful when assessing broader blockchain health.
Investors can ask:
- Is address activity growing?
- Is transaction activity growing?
- Is economic value transferred increasing?
- Are fees sustainable?
- Are applications attracting users?
- Is developer activity healthy?
- Is the network maintaining security?
- Is usage concentrated in a small number of entities?
The answers provide a more complete picture than a single active-address number.
A Practical Example
Imagine a smart-contract blockchain experiences a major price rally.
At first, active addresses increase sharply.
Transaction counts also rise.
Stablecoin transfers increase.
DeFi applications record higher activity.
Network fees increase moderately.
This combination may suggest that the rally is accompanied by broader ecosystem participation.
Now imagine a different scenario.
The token price rises 100%, but active addresses remain flat, transaction activity declines, and application usage does not increase.
That divergence may encourage investors to investigate whether the price movement is being driven primarily by speculation rather than expanding network use.
Neither scenario predicts the future.
But the comparison provides valuable research information.
Active Addresses and Market Cycles
Network activity can change throughout market cycles.
During bull markets, rising prices often attract new participants.
Speculation increases.
Applications can experience higher usage.
Transaction demand may expand.
During bear markets, speculative activity often declines.
Some users leave the ecosystem.
Transaction activity can fall.
However, the underlying network may continue to develop even during periods of weak token prices.
This is particularly important for investors with long-term horizons.
Short-term token performance and long-term network development are not always synchronized.
Combining Active Addresses With Other Metrics
Active addresses become more powerful when combined with the other metrics covered in this article.
Active Addresses + MVRV
This combination compares network activity with market valuation.
If valuation rises much faster than network activity, investors may investigate the divergence.
Active Addresses + SOPR
This can help compare network participation with realized investor behavior.
Active Addresses + Exchange Flows
This can provide context about whether increased activity is occurring alongside changing exchange-held supply.
Active Addresses + Whale Activity
Large-holder movements can help explain unusual changes in network activity.
The broader principle is simple:
Use network activity to understand usage, not as a standalone price prediction tool.
Common Mistakes With Active-Address Data
Mistake 1: Treating Addresses as People
An address is not necessarily an individual.
Mistake 2: Ignoring the Source of Activity
Airdrops, bots, exchanges, and applications can create large numbers of transactions.
Mistake 3: Focusing on One Day
Temporary spikes can be misleading.
Mistake 4: Ignoring Transaction Value
A large number of small transactions may have different economic significance from a smaller number of high-value transactions.
Mistake 5: Ignoring Fees
High activity with unsustainable fees can indicate congestion rather than healthy growth.
Mistake 6: Comparing Different Chains Without Context
Bitcoin, Ethereum, Solana, and other networks have different architectures and use cases.
Their activity metrics should not always be compared directly.
How Investors Can Track Network Activity
A practical research process can include:
Step 1: Monitor active-address trends.
Look at daily, weekly, and monthly activity.
Step 2: Compare active addresses with transaction counts.
Determine whether more addresses or existing addresses are driving growth.
Step 3: Examine transaction value.
Determine whether economic value transferred is also increasing.
Step 4: Monitor fees.
Check whether network demand is creating sustainable or excessive fee pressure.
Step 5: Identify the source of activity.
Determine whether growth comes from DeFi, stablecoins, NFTs, payments, exchanges, or other applications.
Step 6: Compare with token valuation.
Look for major divergences between market capitalization and network usage.
Step 7: Combine with other on-chain metrics.
Use MVRV, SOPR, exchange flows, and whale activity for additional context.
Key Takeaway
Active addresses are an important component of on-chain analytics because they provide a measurable view of blockchain address activity and network participation.
Growing active addresses can indicate expanding activity, but they should never automatically be interpreted as evidence of growing human adoption or a future price increase.
The strongest analysis combines active addresses with transaction counts, economic value transferred, fees, application usage, address quality, and long-term trends.
For crypto investors, the most useful question is not simply:
“Are active addresses rising?”
It is:
“Why are active addresses rising, who is generating the activity, and is the increase sustainable?”
Answering those questions transforms a basic metric into meaningful blockchain research.
Whale Activity and Large-Holder Movements
The fifth and final metric in this guide to on-chain analytics focuses on one of the most closely watched groups in cryptocurrency markets: whales and large holders.
Large holders can control significant amounts of a cryptocurrency’s circulating supply. Their transactions can therefore attract attention from investors, analysts, traders, and the wider crypto community.
When a large wallet transfers millions of dollars worth of Bitcoin, Ethereum, or another digital asset, market participants often want to know what it means.
Is the holder accumulating?
Is the holder distributing?
Is the asset moving to an exchange?
Is the wallet simply being reorganized?
Is the address controlled by an exchange, custodian, institution, protocol, or individual?
These questions demonstrate why whale activity can be useful—but also why it can be easy to misinterpret.
A large blockchain transaction is not automatically a bullish or bearish signal.
The real value comes from understanding the identity, destination, timing, size, frequency, and broader context surrounding large-holder movements.
What Is a Crypto Whale?
A crypto whale is generally understood as an individual, organization, wallet, or entity holding a sufficiently large amount of a cryptocurrency that its transactions could potentially influence market liquidity or sentiment.
There is no universal definition of a whale.
The threshold can differ depending on the asset.
For Bitcoin, a whale may control a large number of BTC.
For a smaller altcoin, a much smaller dollar value may represent a significant percentage of the circulating supply.
Therefore, whale analysis should be evaluated relative to:
- Total circulating supply
- Market capitalization
- Liquidity
- Trading volume
- Token distribution
- Number of large holders
- Asset-specific characteristics
The size of a wallet alone does not tell the complete story.
Why Whale Activity Matters
Large holders can have a meaningful influence on supply distribution.
If a small number of entities control a substantial portion of an asset, their decisions may have greater market significance than those of smaller holders.
Whale activity can therefore help investors investigate:
- Accumulation
- Distribution
- Exchange deposits
- Exchange withdrawals
- Large transfers
- Changes in wallet balances
- Supply concentration
- Holder behavior
This can add another layer to market analysis.
For example, suppose an asset’s price is rising while large holders are steadily increasing their balances.
That may provide evidence of accumulation by large entities.
Alternatively, if prices rise sharply while large holders begin transferring substantial amounts toward exchange-associated addresses, investors may monitor the situation more closely for potential distribution.
Neither observation guarantees a future price movement.
Whale Accumulation
Whale accumulation refers broadly to situations in which large holders appear to be increasing their exposure to an asset.
Analysts may monitor:
- Increasing whale balances
- Large purchases
- Transfers from exchanges to large wallets
- Reduced exchange-held supply
- Increasing concentration among large holders
Accumulation can be especially interesting when it occurs during periods of market weakness.
For example, imagine a cryptocurrency experiences a significant correction.
During the decline:
- Price falls
- Exchange balances decline
- Large holders increase their holdings
- Long-term holder supply remains stable
- Selling pressure begins decreasing
This combination could indicate that some large participants are using weakness to build positions.
But investors should still investigate whether the addresses represent genuine independent holders.
A single institution may control many wallets.
An exchange may also hold assets on behalf of thousands of customers.
Whale Distribution
Whale distribution occurs when large holders reduce their positions.
This may happen during:
- Strong rallies
- Profit-taking periods
- Portfolio rebalancing
- Liquidity events
- Risk reduction
- Market-cycle transitions
Distribution can become more significant when it is persistent and widespread.
For example, if multiple independent large holders steadily reduce their balances while exchange inflows increase and realized profits rise, the combined evidence may suggest increasing distribution pressure.
But one large transfer is not enough to establish a distribution trend.
Whale Transactions and Exchange Addresses
One of the most important distinctions in whale analysis is the destination of the transfer.
A large wallet moving assets to an exchange can attract attention because those assets may become more readily available for trading.
However:
Transfer to exchange ≠ confirmed sale
The holder may deposit the asset and continue holding it.
They may trade it for another cryptocurrency.
They may use it as collateral.
The transaction could also be part of institutional operations.
Therefore, exchange destination is a potential market signal, not proof of a completed trade.
The same principle applies in reverse.
Withdrawal from exchange ≠ confirmed accumulation
The asset could be transferred to another trading platform, a custodian, a DeFi protocol, or an institutional wallet.
Whale Activity and Supply Concentration
Another important concept is supply concentration.
Suppose a cryptocurrency has a relatively small number of addresses controlling a large percentage of circulating tokens.
This creates a more concentrated ownership structure.
Concentration can create both opportunities and risks.
Potential Advantages
Large holders may provide long-term capital and demonstrate strong conviction.
They may also contribute to liquidity under certain circumstances.
Potential Risks
Highly concentrated ownership can increase the potential impact of large-holder decisions.
If several major holders decide to sell at the same time, available market liquidity may be insufficient to absorb the supply without significant price movement.
This is particularly relevant for smaller-cap cryptocurrencies.
Not Every Whale Is an Investor
A critical limitation of whale analysis is that blockchain addresses do not always reveal the identity of their owners.
A large wallet may belong to:
- An exchange
- A custodian
- An ETF-related entity
- A market maker
- A foundation
- A company treasury
- A DeFi protocol
- A bridge
- A staking contract
- An individual investor
- An institutional investor
This is why address labeling and entity identification are so important.
Without reliable attribution, it can be dangerous to assume that a large wallet represents one person making a directional investment decision.
Whale Alerts and Social Media
Crypto social media frequently highlights large transactions.
Posts may say:
“A whale just moved $100 million in Bitcoin!”
These alerts can generate significant attention.
But the transaction itself may not be meaningful.
For example, an exchange could transfer customer funds between cold and hot wallets.
A custodian could reorganize institutional assets.
A protocol could move treasury funds.
An investor could move assets between personal wallets.
Therefore, investors should investigate the transaction before interpreting it.
A better process is:
Transaction → Address identification → Destination → Historical behavior → Market context → Confirmation
This approach reduces the risk of making decisions based on sensational headlines.
Whale Activity and MVRV
Whale activity can become particularly useful when combined with MVRV.
Imagine MVRV is elevated, meaning aggregate market profitability is relatively high.
At the same time, large holders begin transferring assets toward exchanges.
This could indicate that some profitable participants are considering reducing exposure.
Now consider the opposite environment.
MVRV is depressed after a prolonged decline, while large holders steadily increase balances.
The combination may provide evidence of accumulation by larger participants.
Neither scenario predicts the future with certainty.
But combining valuation with holder behavior can produce stronger context.
Whale Activity and SOPR
SOPR can help determine whether transferred coins are being realized at profits or losses.
Suppose whale balances are declining while SOPR is significantly above 1.
This could indicate that profitable holders are realizing gains.
If whale balances decline while SOPR remains below 1, the behavior may instead involve loss realization or forced selling.
The interpretation depends on the asset and the methodology used to identify large holders.
Whale Activity and Exchange Flows
This is one of the most useful combinations.
Consider the following hypothetical pattern:
- Large wallets increase exchange deposits
- Exchange netflows become positive
- SOPR rises above 1
- MVRV becomes elevated
- Price approaches a major historical resistance zone
No individual metric guarantees a market reversal.
But together, these signals may indicate increasing profit-taking risk.
Now consider:
- Large wallets withdraw assets from exchanges
- Exchange balances decline
- MVRV remains depressed
- SOPR begins recovering
- Price stabilizes after a prolonged decline
This combination may indicate a changing supply environment.
Again, the objective is not to predict the future perfectly.
It is to identify shifts in market behavior.
Whale Activity and Active Addresses
Combining whale behavior with network activity can also reveal useful information.
Suppose active addresses are increasing while large holders are accumulating.
This could indicate that broader network participation and large-holder positioning are strengthening at the same time.
But if active addresses are declining while whale concentration continues to increase, the market may be becoming more concentrated.
Such a situation could create different risks, especially for smaller blockchain ecosystems.
Measuring Whale Balance Changes
One useful method is to monitor how the total balance held by a defined group of large addresses changes over time.
For example:
Whale Balance Change = Current Whale Holdings − Previous Whale Holdings
If the result is positive, the tracked group increased its holdings.
If negative, it decreased its holdings.
The exact threshold for inclusion in a whale cohort can vary by asset and analytics provider.
For this reason, investors should avoid comparing whale-balance datasets without understanding their methodology.
Whale Accumulation Does Not Guarantee a Price Increase
This is another important warning.
Even if large holders accumulate an asset, the price can still decline.
Why?
Because:
- Other holders may sell
- Macro conditions may deteriorate
- Liquidity may decline
- Demand may weaken
- Token supply may increase
- The large holders may be hedging
- The addresses may not represent independent investors
Whale accumulation is therefore best viewed as one piece of evidence.
Whale Distribution Does Not Guarantee a Crash
The opposite is also true.
Large-holder selling does not automatically mean a market will collapse.
Markets can absorb substantial distribution when demand is strong.
New investors may purchase the assets being sold.
Institutional demand may offset whale selling.
Trading liquidity can also increase during strong market conditions.
Therefore, the important question is not simply:
“Are whales selling?”
It is:
“How much are they selling, where are the assets going, and is the market absorbing the supply?”
Large Holders and Smaller-Cap Tokens
Whale analysis becomes particularly important for smaller-cap cryptocurrencies.
A wallet controlling 1% of Bitcoin’s supply would represent an enormous position.
For a smaller token, however, one wallet may control a much larger percentage of circulating supply.
This creates greater concentration risk.
Investors researching smaller-cap assets should therefore investigate:
- Top holder concentration
- Foundation holdings
- Team allocations
- Vesting schedules
- Treasury balances
- Exchange wallets
- Market-maker wallets
- Circulating supply
- Fully diluted valuation
On-chain analytics can help investors understand these structures before committing capital.
Token Unlocks and Whale Supply
Token unlocks are another important consideration.
A project may have substantial tokens scheduled to enter circulation.
Even if existing whales are not selling, newly unlocked tokens can change the supply environment.
Investors should therefore combine whale analysis with tokenomics.
Important questions include:
- Who receives the unlocked tokens?
- When are they released?
- How large is the unlock relative to daily trading volume?
- Are recipients likely to sell?
- Are tokens going to investors, employees, foundations, or ecosystem programs?
This creates a bridge between on-chain analytics and fundamental crypto research.
Common Mistakes in Whale Analysis
Mistake 1: Assuming Every Large Wallet Is a Whale Investor
Many large wallets belong to organizations or infrastructure providers.
Mistake 2: Assuming Every Transfer Is a Trade
A blockchain transfer is not necessarily a market transaction.
Mistake 3: Ignoring Wallet Relationships
Multiple addresses can belong to the same entity.
Mistake 4: Following Social-Media Headlines Blindly
Large transaction alerts can lack important context.
Mistake 5: Ignoring Liquidity
A large transaction has different implications in a highly liquid market versus a thinly traded market.
Mistake 6: Ignoring Tokenomics
Supply unlocks and emissions can be just as important as existing whale balances.
A Practical Whale-Tracking Framework
Investors can use a structured process when studying large-holder behavior.
Step 1: Define the whale threshold.
Use an appropriate threshold for the asset being analyzed.
Step 2: Identify known entities.
Separate exchanges, custodians, protocols, foundations, and other known organizations from potentially independent holders.
Step 3: Track balance changes.
Monitor whether large-holder balances are increasing or decreasing.
Step 4: Examine destinations.
Determine whether assets are moving toward exchanges, custodians, DeFi protocols, or other wallets.
Step 5: Measure persistence.
Look for repeated behavior rather than one isolated transfer.
Step 6: Compare with MVRV and SOPR.
Determine whether large-holder behavior is occurring during high or low profitability conditions.
Step 7: Check network activity.
Determine whether whale movements coincide with broader changes in blockchain usage.
Step 8: Consider liquidity and tokenomics.
Large-holder movements matter more when market liquidity is limited or supply concentration is high.
Why Whale Activity Is Only One of Five Metrics
Whale activity can be highly informative, but it should not dominate an investor’s entire research process.
The five metrics covered in this guide each answer different questions:
MVRV:
What is the relationship between market value and realized value?
SOPR:
Are transferred coins generally being realized at profits or losses?
Exchange Flows:
Where are assets moving in relation to exchange-associated addresses?
Active Addresses:
How much address-level activity is occurring on the blockchain?
Whale Activity:
How are large holders and significant entities changing their positions?
When these metrics are considered together, investors can develop a much broader understanding of market conditions.
Key Takeaway
Whale activity is an important component of on-chain analytics because large-holder movements can reveal changes in supply distribution, accumulation, distribution, and potential market positioning.
But investors must avoid treating every large transaction as a direct market signal.
The identity of the address, destination of the assets, transaction history, liquidity conditions, tokenomics, and broader market environment all matter.
The strongest approach is to combine whale data with MVRV, SOPR, exchange flows, active addresses, price structure, and fundamental research.
That turns whale tracking from social-media speculation into a more disciplined analytical process.
How to Combine the 5 On-Chain Metrics Into a Practical Investment Framework
Understanding individual metrics is only the beginning of effective on-chain analytics.
MVRV can provide valuation context. SOPR can reveal realized profit and loss. Exchange flows can show where assets are moving. Active addresses can provide insight into network activity. Whale analysis can reveal changes among large holders.
But investors rarely make decisions based on one metric alone.
The real advantage comes from combining these signals into a structured framework.
This approach is often called confluence.
Instead of asking whether one indicator is bullish or bearish, investors can ask:
Do multiple independent sources of blockchain data support the same interpretation?
That question can lead to a much more disciplined approach to crypto market research.
The Five Metrics at a Glance
Before combining the metrics, it helps to understand the specific question each one attempts to answer.
| Metric | Main Question | What It Can Help Reveal |
|---|---|---|
| MVRV | How does market value compare with realized value? | Aggregate profitability and valuation context |
| SOPR | Are transferred coins being realized at profits or losses? | Realized investor behavior |
| Exchange Flows | Where are assets moving? | Potential changes in exchange-held supply |
| Active Addresses | How actively is the blockchain being used? | Network participation and activity |
| Whale Activity | What are large holders doing? | Accumulation, distribution, and concentration |
These metrics measure different aspects of the market.
That is precisely why combining them can be useful.
Why Confluence Matters
Imagine an investor sees Bitcoin’s price rising 20%.
A price chart alone tells the investor that the asset has appreciated.
But it does not necessarily explain whether:
- Long-term holders are selling
- New participants are entering
- Exchange balances are changing
- Profits are being realized
- Network activity is expanding
- Large holders are accumulating
On-chain analytics can add these additional layers.
Suppose the investor finds:
- MVRV is increasing
- SOPR is above 1
- Exchange inflows are rising
- Active addresses are increasing
- Large holders are taking profits
The combined picture is more informative than any individual metric.
It could indicate a market where valuation and profitability are increasing while some participants are distributing supply.
That does not guarantee a reversal.
But it gives the investor a reason to monitor risk more carefully.
A Bullish Confluence Scenario
Consider a hypothetical cryptocurrency that has experienced a prolonged market decline.
The following conditions begin to appear:
MVRV
MVRV is relatively depressed compared with its historical range.
SOPR
SOPR begins recovering from prolonged periods below 1.
Exchange Flows
Exchange balances begin declining as more assets move away from exchange-associated addresses.
Active Addresses
Network activity begins stabilizing and then gradually increases.
Whale Activity
Large holders begin increasing their balances.
Individually, none of these signals proves that a major market recovery is coming.
Together, however, they can create a more constructive picture.
The combination may suggest:
- Reduced realized selling pressure
- Improving holder profitability
- Lower exchange-held supply
- Recovering network participation
- Increased large-holder interest
An investor could therefore classify the environment as potentially improving, while still waiting for additional confirmation from price structure and market liquidity.
A Bearish-Risk Confluence Scenario
Now consider the opposite.
A cryptocurrency has experienced a rapid rally.
The data shows:
- MVRV reaches historically elevated territory
- SOPR remains significantly above 1
- Exchange inflows increase
- Active-address growth begins slowing
- Large holders transfer substantial amounts toward exchanges
Again, this does not guarantee a market crash.
But the combination may indicate increasing distribution risk.
The investor may respond by:
- Monitoring volatility more closely
- Reviewing position size
- Checking liquidity conditions
- Watching support levels
- Tracking additional on-chain signals
- Avoiding excessive leverage
The objective is not to predict a precise top.
It is to recognize that the risk environment may be changing.
A Neutral or Conflicting Scenario
One of the most important lessons in on-chain analytics is that metrics do not always agree.
For example:
- MVRV may be elevated
- SOPR may be moderate
- Exchange balances may be declining
- Active addresses may be rising
- Whales may be accumulating
What should an investor conclude?
Not every situation requires a bullish or bearish label.
The correct conclusion may simply be:
The signals are mixed.
This is a valuable result.
Conflicting indicators can encourage investors to wait for additional information rather than forcing a premature decision.
Good analysis is not about producing a prediction at all times.
Sometimes the best conclusion is:
“There is not enough evidence yet.”
Step 1: Establish the Market Regime
Before interpreting individual metrics, identify the broader market environment.
Ask:
- Is the asset in a bull market?
- Is it in a bear market?
- Is it moving sideways?
- Is volatility increasing?
- Is liquidity expanding or contracting?
- Is the broader crypto market strengthening or weakening?
The same on-chain reading can have different meanings in different market regimes.
For example, SOPR above 1 during a strong bull market can represent healthy profit realization.
The same behavior near a major market peak could deserve greater attention.
Step 2: Examine Valuation With MVRV
Next, assess the valuation environment.
Ask:
- Is MVRV relatively low?
- Is it near historical averages?
- Is it elevated?
- Is it rising or falling?
- How does the current reading compare with previous cycles?
The purpose is not to identify a magical threshold.
Instead, determine whether aggregate profitability appears relatively depressed, normal, or elevated.
Step 3: Examine Realized Behavior With SOPR
After valuation, examine what investors are actually realizing.
Ask:
- Is SOPR above or below 1?
- Is it rising or falling?
- Are profits increasing?
- Are losses increasing?
- Are short-term holders driving the behavior?
- Is the pattern persistent?
This helps distinguish between unrealized profitability and actual realized behavior.
Step 4: Examine Exchange Flows
Next, investigate where assets are moving.
Look for:
- Rising inflows
- Rising outflows
- Positive netflows
- Negative netflows
- Long-term balance changes
- Large exchange deposits
- Large exchange withdrawals
The most important question is:
Is there a persistent trend?
Avoid making conclusions based on one transaction.
Step 5: Examine Network Activity
Now consider whether blockchain usage supports the broader market picture.
Check:
- Active addresses
- Transaction count
- Transaction value
- Fees
- Application activity
- Stablecoin activity
- DeFi usage
If network activity is strengthening alongside market valuation, that may provide additional context.
If valuation rises dramatically while network activity stagnates, the divergence may deserve further investigation.
Step 6: Examine Whale Behavior
Finally, investigate large-holder movements.
Ask:
- Are whales accumulating?
- Are they distributing?
- Are large balances increasing?
- Are assets moving toward exchanges?
- Are assets moving toward custody?
- Is supply becoming more concentrated?
Large-holder behavior can be particularly important when analyzing long-term Bitcoin market cycles. Investors can compare whale activity with broader market trends and Bitcoin price predictions for 2027 to develop a more complete long-term research framework.
Always check whether large addresses belong to known entities.
Creating a Simple On-Chain Dashboard
Investors do not need hundreds of metrics to build a useful monitoring system.
A simple dashboard could contain:
Market Conditions
- Price
- Market capitalization
- Trading volume
- Volatility
Valuation
- MVRV
- Realized capitalization
Realized Behavior
- SOPR
- Short-term holder behavior
- Long-term holder behavior
Supply Movement
- Exchange inflows
- Exchange outflows
- Exchange balances
Network Activity
- Active addresses
- Transaction count
- Fees
- Application activity
Large Holders
- Whale balances
- Large transactions
- Supply concentration
This provides a balanced overview without overwhelming the investor with unnecessary information.
Daily vs. Weekly vs. Monthly Analysis
Another important consideration is time frame.
Daily Monitoring
Daily data can help identify:
- Sudden exchange movements
- Large whale transactions
- Short-term SOPR changes
- Abrupt activity spikes
However, daily data can be noisy.
Weekly Monitoring
Weekly analysis can help identify:
- Persistent exchange trends
- Changes in holder profitability
- Network activity trends
- Emerging accumulation or distribution patterns
Monthly Monitoring
Monthly analysis is useful for:
- Market-cycle analysis
- Long-term valuation
- Network growth
- Supply distribution
- Structural changes
Investors with long-term horizons should generally avoid allowing short-term noise to dominate their conclusions.
On-Chain Analytics for Different Types of Investors
Not every investor needs the same framework.
Long-Term Investors
Long-term investors may focus more heavily on:
- MVRV
- Long-term holder behavior
- Supply distribution
- Exchange balances
- Network growth
Their objective is to understand structural changes rather than daily price fluctuations.
Swing Traders
Swing traders may focus more heavily on:
- SOPR
- Exchange flows
- Whale movements
- Short-term holder behavior
- Price structure
They may use on-chain metrics as confirmation for shorter-term market setups.
Institutional Investors
Institutional participants may combine on-chain data with:
- Liquidity analysis
- Derivatives positioning
- ETF flows
- Macro data
- Custody information
- Market microstructure
- Risk management systems
The scale and sophistication of the framework can vary considerably.
Using On-Chain Data With Technical Analysis
On-chain analytics should not replace technical analysis.
Instead, the two can complement each other.
For example:
Technical Analysis:
Bitcoin technical analysis can help identify when Bitcoin breaks above a major resistance level.
On-Chain Analysis:
Active addresses are increasing, exchange balances are declining, and large holders are accumulating.
The combination may provide stronger confirmation than the technical breakout alone.
Now consider another situation:
Technical Analysis:
Bitcoin breaks above resistance.
On-Chain Analysis:
MVRV is extremely elevated, SOPR shows aggressive profit realization, and large holders are distributing.
This does not necessarily invalidate the breakout.
But it could warn investors that the move may face increased selling pressure.
The important principle is:
Price tells you what the market is doing. On-chain data can provide additional evidence about what participants are doing.
Avoiding Confirmation Bias
One of the greatest risks in crypto research is confirmation bias.
An investor who is already bullish may search for bullish on-chain signals.
A bearish investor may do the opposite.
A disciplined framework should therefore actively search for both supporting and conflicting evidence.
For every bullish signal, ask:
What would invalidate this interpretation?
For every bearish signal, ask:
What evidence would challenge this interpretation?
This approach improves analytical discipline.
Avoiding Overfitting
Another risk is overfitting.
Investors can discover historical patterns that appear extremely accurate when tested against past data but perform poorly in future conditions.
For example, a particular MVRV level may have appeared near several historical market tops.
That does not mean the exact same threshold will work forever.
Market structure evolves.
Investor composition changes.
Institutional participation changes.
Liquidity changes.
Blockchain usage changes.
Therefore, historical relationships should be treated as contextual evidence, not immutable laws.
Understanding Data Quality
Not all on-chain datasets are identical.
Different providers may use different:
- Address labels
- Entity classifications
- Filtering methods
- Realized-value calculations
- Exchange identification techniques
- Time frames
- Statistical methods
Before using a metric, investors should understand how it is constructed.
This is especially important when comparing data from multiple platforms.
Two dashboards may display different numbers while both are technically correct according to their own methodologies.
The Importance of Context
On-chain metrics exist within a larger financial system.
Crypto markets are affected by:
- Interest rates
- Global liquidity
- Inflation expectations
- Regulatory developments
- Institutional flows
- Stablecoin issuance
- Equity markets
- Dollar strength
- Geopolitical developments
- Technological changes
A blockchain metric cannot fully capture these external forces.
For example, an asset could show strong on-chain accumulation while a major liquidity shock causes broad risk assets to fall.
This does not make the on-chain data useless.
It simply means that blockchain data represents one part of the investment picture.
A Five-Metric Decision Matrix
Investors can create a simple qualitative framework.
Potentially Constructive Environment
- MVRV: Depressed or recovering
- SOPR: Recovering toward or above 1
- Exchange flows: Persistent outflows
- Active addresses: Improving
- Whale activity: Accumulation
Potentially Elevated-Risk Environment
- MVRV: Highly elevated
- SOPR: Strong profit realization
- Exchange flows: Persistent inflows
- Active addresses: Weakening or diverging
- Whale activity: Distribution
Uncertain Environment
- MVRV: Mixed
- SOPR: Neutral
- Exchange flows: Balanced
- Active addresses: Flat
- Whale activity: Mixed
This matrix should not be treated as a trading algorithm.
It is simply a structured way to organize evidence.
The 5-Metric Checklist
Before making an investment decision based partly on blockchain data, investors can ask:
- What does MVRV say about valuation?
- What does SOPR say about realized profit and loss?
- Where are assets moving?
- Is network activity expanding or contracting?
- What are large holders doing?
- Do the metrics agree?
- Are there important conflicting signals?
- What does price structure indicate?
- What are liquidity and macro conditions doing?
- Is the data methodology reliable?
This simple checklist can prevent many common analytical mistakes.
What On-Chain Analytics Cannot Tell You
Despite its usefulness, on-chain analytics has clear limitations.
It cannot reliably tell investors:
- Exactly who owns every wallet
- Why every transaction occurred
- Whether every exchange deposit will be sold
- Whether every withdrawal represents accumulation
- Exactly when a market will reach a top
- Exactly when a market will reach a bottom
- Whether a particular whale is bullish or bearish
- What an investor will do next
Blockchain data provides evidence.
It does not provide perfect access to investor intentions.
That distinction is essential.
From Raw Blockchain Data to Investment Insight
The full process can be summarized as:
Raw Blockchain Data
↓
Address and Entity Classification
↓
Metric Construction
↓
Historical Comparison
↓
Cross-Metric Analysis
↓
Market Context
↓
Risk Assessment
↓
Investment Decision
The final step belongs to the investor.
On-chain analytics can improve the quality of information available to an investor, but it cannot remove uncertainty from financial markets.
Key Takeaway
The greatest strength of on-chain analytics is not any single metric.
It is the ability to combine different blockchain measurements to create a more complete view of market behavior.
MVRV helps investors understand valuation.
SOPR reveals realized profitability.
Exchange flows show asset movement.
Active addresses provide insight into network activity.
Whale analysis helps monitor large-holder behavior.
When these metrics point in the same direction, the resulting signal can become more informative.
When they disagree, investors should recognize the uncertainty rather than forcing a conclusion.
The goal is not to predict every market movement.
The goal is to make better-informed, evidence-based decisions.
Limitations, Risks, Tools, and Best Practices for On-Chain Analytics
The growing availability of blockchain data has transformed the way cryptocurrency investors research digital assets.
Instead of relying exclusively on price charts, social-media sentiment, or news headlines, investors can examine transactions, wallet balances, exchange movements, network activity, realized profits, and large-holder behavior.
This is the core advantage of on-chain analytics.
However, more data does not automatically mean better investment decisions.
Blockchain data has limitations, and investors who misunderstand those limitations can easily draw incorrect conclusions.
A sophisticated approach therefore requires two skills:
Knowing what the data says
and
Knowing what the data does not say.
This distinction is essential for using on-chain metrics responsibly.
The Biggest Limitation: Blockchain Data Shows Activity, Not Intent
A blockchain records transactions.
It does not record the reason behind every transaction.
For example, a wallet may send $20 million worth of Bitcoin to another address.
The blockchain can show:
- Sending address
- Receiving address
- Amount transferred
- Transaction time
- Transaction fee
- Transaction hash
But the blockchain may not tell us whether the owner intended to:
- Sell
- Hold
- Trade
- Move into custody
- Rebalance
- Use collateral
- Transfer between related entities
This creates an important distinction:
On-chain data can reveal behavior, but it does not always reveal intent.
Investors should therefore avoid making strong conclusions from isolated transactions.
Address Identification Is Imperfect
One of the most important challenges in on-chain analytics is determining who controls a particular address.
Some addresses can be identified with reasonable confidence.
For example, analytics providers may label known:
- Centralized exchanges
- DeFi protocols
- Bridges
- Foundations
- Custodians
- Mining entities
- Institutional wallets
But many blockchain addresses remain unidentified.
A large wallet may belong to an individual, company, exchange, custodian, or another organization.
This means that statements such as:
“A whale is buying.”
should be treated carefully unless the address has been reliably identified.
Exchange Wallets Can Create Confusing Signals
Centralized exchanges often control many wallets.
They may regularly move assets between:
- Hot wallets
- Cold wallets
- Deposit addresses
- Withdrawal wallets
- Custody systems
- Internal settlement addresses
These transfers can create large on-chain movements without representing a change in the exchange’s overall customer holdings.
For this reason, sophisticated exchange-flow analysis attempts to account for known internal transfers whenever possible.
Investors should be cautious when interpreting a large exchange transaction without understanding the surrounding wallet structure.
Self-Transfers Can Create Noise
A user can control multiple addresses.
They may move assets between their own wallets.
For example:
Wallet A → Wallet B → Wallet C
could look like multiple independent transfers even though one entity controls all three addresses.
This can affect:
- Whale metrics
- Active addresses
- Exchange flows
- Transaction counts
- Holder distribution
Entity clustering can help reduce this problem, but no system is perfect.
Active Addresses Are Not Unique Users
This limitation deserves special attention.
An active-address count of one million does not necessarily mean that one million people used the blockchain.
A single individual may control:
- Five addresses
- Ten addresses
- Hundreds of addresses
An exchange or protocol may control even more.
Automated systems can also generate large amounts of activity.
Therefore:
Active addresses measure address activity, not guaranteed human adoption.
This is why network-health analysis should include additional indicators.
Transaction Count Can Be Misleading
A blockchain can process a large number of transactions without generating equivalent economic value.
For example, automated applications can produce thousands of low-value transactions.
Conversely, a small number of large institutional transactions can transfer billions of dollars.
Therefore, investors should consider transaction count together with:
- Active addresses
- Transaction value
- Fees
- Application activity
- Economic value transferred
This creates a more balanced view of network usage.
Whale Metrics Have Their Own Problems
Whale analysis is attractive because large transactions are easy to understand.
But the underlying data can be complicated.
A large wallet may be:
- An exchange
- A custodian
- A market maker
- A foundation
- A treasury
- A protocol
- A bridge
- An institutional investor
- An individual
Without reliable entity attribution, investors can easily mistake operational activity for investment activity.
This is particularly dangerous when social media converts an unexplained transaction into a bullish or bearish narrative.
MVRV Has Methodological Limitations
MVRV depends on realized-value calculations.
Those calculations require assumptions about how coins are valued when they last moved.
Different analytics providers may apply different methodologies.
Other complications can include:
- Lost coins
- Dormant coins
- Exchange-held assets
- Custody structures
- Token migrations
- Wrapped assets
- Complex smart-contract activity
Therefore, investors should not blindly compare MVRV readings from different platforms without understanding their methodology.
SOPR Also Requires Context
SOPR can provide useful information about realized profit and loss, but it also has limitations.
Not every blockchain transfer represents a market sale.
Coins can move between:
- Personal wallets
- Custodians
- Exchanges
- Institutional addresses
- Smart contracts
A transaction that creates a realized-profit calculation does not necessarily mean the holder sold the asset on the open market.
Therefore, SOPR should be interpreted as a measure of realized on-chain behavior, not a direct measurement of market sell orders.
Exchange Flows Are Not Buy and Sell Orders
This principle is worth repeating.
An exchange inflow does not automatically mean:
Sell order
An exchange outflow does not automatically mean:
Buy order
The asset could be deposited or withdrawn for many reasons.
Therefore, exchange flows should be combined with:
- Order-book data
- Trading volume
- Price action
- SOPR
- MVRV
- Whale activity
when investors need stronger evidence of actual market pressure.
On-Chain Data Can Lag Market Events
Some blockchain metrics may react after a market event has already begun.
Price can move rapidly because of:
- News
- Liquidations
- Macro announcements
- ETF flows
- Regulatory developments
- Sudden changes in liquidity
Blockchain activity may then change in response.
This means on-chain metrics are not always leading indicators.
Some are better understood as confirmation or contextual indicators.
Different Blockchains Require Different Frameworks
Another common mistake is assuming that one metric works identically across all networks.
Bitcoin, Ethereum, Solana, and other blockchains have different:
- Consensus mechanisms
- Transaction structures
- Fee markets
- Smart-contract capabilities
- User behaviors
- Tokenomics
- Application ecosystems
Ethereum provides an important example of a blockchain ecosystem with smart-contract functionality and decentralized applications. Readers can learn more about Ethereum’s technology and ecosystem through the official Ethereum.org resources.
A high transaction count on one network may represent something completely different on another.
Therefore, investors should understand the architecture and use case of the blockchain before interpreting its metrics.
Tokenomics Can Change the Meaning of On-Chain Data
On-chain metrics should always be considered alongside tokenomics.
Tokenization is also expanding beyond traditional cryptocurrencies into financial assets such as private credit. The growth of tokenized private credit demonstrates how real-world financial assets can increasingly be represented and managed on blockchain networks.
Important factors include:
- Maximum supply
- Circulating supply
- Inflation
- Emissions
- Token unlocks
- Vesting schedules
- Treasury holdings
- Foundation allocations
- Staking rewards
- Burn mechanisms
Suppose a cryptocurrency shows increasing active addresses.
That sounds constructive.
But if the token simultaneously experiences extremely high inflation and large scheduled unlocks, the investment picture may be more complicated.
Network usage and token economics must therefore be analyzed together.
DeFi Creates Additional Complexity
Decentralized finance introduces another layer of complexity.
Assets can move through lending protocols, automated market makers, liquidity pools, bridges, staking contracts, and other smart-contract-based applications. AI-driven smart contracts are also becoming an emerging area of blockchain development, adding another layer of automation to decentralized applications.
Assets can move through:
- Lending protocols
- Automated market makers
- Liquidity pools
- Bridges
- Staking contracts
- Restaking systems
- Yield protocols
A token moving into a smart contract does not necessarily indicate buying or selling.
For example, a user may deposit ETH into a DeFi protocol.
The transaction changes the blockchain’s address balances, but the user’s economic exposure may not have changed significantly.
Investors must therefore understand the role of smart contracts when interpreting on-chain movements.
Layer-2 Networks Change the Data Picture
Scaling solutions can also complicate blockchain analytics.
Activity may occur on:
- Ethereum mainnet
- Layer-2 networks
- Sidechains
- App-specific chains
- Rollups
A decline in activity on one layer does not necessarily mean that users have abandoned the broader ecosystem.
They may simply have moved activity to another network.
This is increasingly important as blockchain ecosystems become more multi-chain.
Bridge Activity Can Be Misinterpreted
Bridges allow assets and value to move between blockchain environments.
A large bridge transaction can therefore look like a major movement of capital.
But investors need to determine:
- Which chain did the asset leave?
- Which chain received it?
- Was the movement caused by a user?
- Was it related to liquidity management?
- Was it an internal protocol operation?
- Was the asset locked or minted elsewhere?
Without this context, bridge data can be misleading.
Choosing Reliable On-Chain Analytics Tools
Investors have access to many blockchain analytics platforms.
The most important consideration is not simply how attractive the dashboard looks.
Instead, evaluate:
Data Coverage
Does the platform cover the chains and assets you actually research?
Methodology
Does it explain how metrics are calculated?
Entity Labels
Does it identify exchanges, protocols, custodians, and other entities?
Historical Data
Can you examine trends over months or years?
Customization
Can you create custom dashboards or alerts?
Transparency
Does the platform explain limitations and assumptions?
These factors can matter more than having hundreds of indicators.
Types of On-Chain Analytics Tools
Different platforms specialize in different types of data.
Network Analytics Platforms
These focus on:
- Active addresses
- Transactions
- Fees
- Network activity
Market-Cycle Platforms
These emphasize:
- MVRV
- SOPR
- Realized capitalization
- Holder behavior
Wallet Intelligence Platforms
These focus on:
- Whale addresses
- Entity identification
- Wallet balances
- Large transactions
DeFi Analytics Platforms
These monitor:
- Total value locked
- Liquidity pools
- Lending
- Borrowing
- Protocol activity
Blockchain Explorers
Explorers provide raw transaction-level information.
They can be useful for verifying individual transactions rather than relying entirely on summarized dashboards.
Verify Important Transactions Yourself
When a large transaction becomes important to an investment thesis, investors should consider checking the underlying blockchain transaction.
A basic verification process can include:
Step 1: Identify the transaction hash.
Step 2: Open the relevant blockchain explorer.
Step 3: Check the sending and receiving addresses.
Step 4: Review the amount transferred.
Step 5: Examine previous and subsequent transactions.
Step 6: Determine whether the addresses have known labels.
Step 7: Compare the transaction with broader market activity.
This process can prevent mistakes caused by misleading social-media interpretations.
Build Alerts Instead of Watching Everything
Investors do not need to monitor blockchain data constantly.
Analytics platforms can often provide alerts for:
- Large wallet transfers
- Exchange deposits
- Exchange withdrawals
- Significant MVRV changes
- SOPR changes
- Network activity spikes
- Token unlocks
Alerts can make research more efficient.
But investors should avoid creating hundreds of alerts.
Too many notifications can produce information overload.
A better strategy is to monitor only events that could materially affect the investment thesis.
Avoid Data Overload
One of the biggest dangers of modern crypto research is having too much information.
An investor can monitor:
- Dozens of on-chain metrics
- Hundreds of wallets
- Multiple exchanges
- Social-media sentiment
- Technical indicators
- Derivatives
- Macroeconomic data
- News
At some point, additional data can reduce clarity rather than improve it.
A focused five-metric framework can be more useful than an enormous dashboard.
The objective is:
Better information → Better interpretation → Better decisions
Not:
More information → More decisions
Use Historical Context
On-chain metrics are most useful when placed into historical context.
Instead of asking:
“Is MVRV high?”
Ask:
“How does today’s MVRV compare with previous market conditions for this asset?”
Instead of:
“Are exchange outflows rising?”
Ask:
“How unusual are these outflows relative to the asset’s historical behavior?”
Instead of:
“Are active addresses increasing?”
Ask:
“Is this growth persistent and economically meaningful?”
Historical context transforms isolated numbers into trends.
Combine On-Chain Data With Fundamental Analysis
On-chain analytics should be part of a broader investment framework.
Fundamental analysis can examine:
- Technology
- Token utility
- Revenue
- Developer activity
- Governance
- Competitive position
- Security
- Tokenomics
- Adoption
- Regulatory environment
Regulatory developments can also influence the cryptocurrency investment environment. Investors should consider current compliance requirements and policy changes alongside blockchain data. For additional context, see our guide to SEC crypto guidance in 2026.
A blockchain can have excellent on-chain activity while its token economics remain unattractive.
Conversely, a project can have temporarily weak activity while its long-term development remains strong.
Investors should therefore consider both the network and the asset.
Combine On-Chain Data With Risk Management
Even excellent analysis cannot eliminate market risk.
Investors should consider:
- Position size
- Liquidity
- Volatility
- Leverage
- Diversification
- Time horizon
- Maximum acceptable loss
On-chain analytics can improve information quality.
Risk management determines how much capital is exposed to uncertainty.
The two should work together.
Best Practices for Crypto Investors
A disciplined on-chain analytics process can follow several principles.
1. Use Multiple Metrics
Avoid relying on one indicator.
2. Study Trends
Look for persistence rather than isolated events.
3. Understand Methodology
Know how your chosen platform calculates its metrics.
4. Verify Important Transactions
Use blockchain explorers when necessary.
5. Identify Entities Carefully
Do not assume every large wallet is an individual investor.
6. Compare With Price
On-chain data and market structure should be studied together.
7. Consider Macro Conditions
Liquidity and broader financial markets can override short-term blockchain signals.
8. Avoid Emotional Decisions
Data should reduce emotional reactions, not create new ones.
9. Watch for Conflicting Evidence
Disagreement between metrics is itself useful information.
10. Never Treat On-Chain Metrics as Certainty
They are analytical tools, not guaranteed prediction machines.
A Complete On-Chain Research Workflow
For investors who want a repeatable process, the following workflow can be useful:
1. Start With Market Conditions
Understand price, volatility, liquidity, and broader market structure.
2. Check MVRV
Determine whether valuation appears historically depressed, normal, or elevated.
3. Check SOPR
Study whether holders are realizing profits or losses.
4. Check Exchange Flows
Examine changes in exchange-related asset movement.
5. Check Active Addresses
Evaluate network participation and usage.
6. Check Whale Activity
Study large-holder balance changes and significant transactions.
7. Review Tokenomics
Consider supply, unlocks, emissions, and concentration.
8. Check Fundamental Factors
Evaluate technology, adoption, development, and competition.
9. Look for Confluence
Determine whether several independent signals support the same interpretation.
10. Define Risk
Decide how the information affects position size and risk exposure.
This workflow turns on-chain analytics into a repeatable research process rather than a collection of interesting charts.
Final Perspective on On-Chain Analytics
Blockchain transparency is one of cryptocurrency’s most important characteristics.
It creates a unique source of information that investors can analyze in ways that are difficult to replicate in many traditional markets.
But transparency does not eliminate uncertainty.
A blockchain can show that assets moved.
It may not show why they moved.
It can show that an address became active.
It may not show who controlled the address.
It can show that coins were realized at a profit.
It may not prove that the holder placed a conventional market sell order.
Understanding these distinctions is what separates responsible on-chain research from simplistic signal chasing.
The most effective investors use blockchain data as evidence within a larger analytical framework.
They combine MVRV, SOPR, exchange flows, active addresses, and whale activity with price structure, tokenomics, fundamental analysis, liquidity, and macroeconomic conditions.
That approach does not guarantee successful investments.
But it can help investors ask better questions, recognize changing market conditions, and make decisions based on a broader body of evidence.
Key Takeaway
On-chain analytics is most powerful when used as a research framework rather than a prediction machine.
The five metrics covered in this guide each provide a different perspective:
- MVRV helps evaluate market valuation and aggregate profitability.
- SOPR helps measure realized profit and loss.
- Exchange flows help track asset movements around trading venues.
- Active addresses help evaluate blockchain activity and participation.
- Whale activity helps monitor large-holder behavior and supply concentration.
Used individually, each metric has limitations.
Used together and interpreted carefully, they can provide a powerful additional layer of information for crypto investors.
The goal is not to predict every market move.
The goal is to understand the blockchain more deeply, recognize important changes in participant behavior, and make more informed investment decisions.
In a market where transparency is one of the defining advantages of blockchain technology, learning how to interpret that transparency can become an important skill for the next generation of crypto investors.
Final Conclusion — Using On-Chain Analytics With Confidence
The cryptocurrency market produces enormous amounts of data every day, but raw data alone does not create better investment decisions. The real advantage comes from knowing how to interpret that information and connect different signals into a coherent market picture.
On-chain analytics gives crypto investors something traditional market analysis cannot always provide: a transparent view of blockchain activity.
Investors can examine how assets move, how holders behave, whether network activity is expanding, whether profits are being realized, and how large holders are changing their positions.
The five metrics discussed throughout this guide provide a practical starting point.
1. MVRV — Understanding Valuation
MVRV helps investors compare market value with realized value.
It can provide historical context about whether an asset’s market valuation appears relatively low, normal, or elevated.
However, MVRV should never be treated as a precise market-top or market-bottom indicator.
2. SOPR — Understanding Realized Profit and Loss
SOPR helps reveal whether coins moving on-chain are generally being realized at a profit or a loss.
It can provide valuable insight into investor behavior, particularly when examined across different market conditions.
3. Exchange Flows — Understanding Supply Movement
Exchange flows help investors monitor how assets move into and out of exchange-associated addresses.
Persistent trends can provide useful information about potential changes in liquid supply.
But an exchange deposit does not automatically mean a sale, and an exchange withdrawal does not automatically mean accumulation.
4. Active Addresses — Understanding Network Activity
Active addresses provide a useful measurement of blockchain participation.
Growing activity can indicate increasing network usage, but active addresses should never automatically be interpreted as unique human users.
Transaction counts, fees, application activity, and economic value transferred should also be considered.
5. Whale Activity — Understanding Large Holders
Large-holder movements can reveal changes in supply concentration and potential accumulation or distribution.
But investors must identify the addresses carefully because exchanges, custodians, protocols, foundations, and other organizations can control large wallets.
The Power of Confluence
The greatest strength of these metrics appears when they are combined.
For example, a potentially constructive market environment might include:
- Depressed or recovering MVRV
- Improving SOPR
- Persistent exchange outflows
- Increasing network activity
- Large-holder accumulation
A potentially higher-risk environment could include:
- Historically elevated MVRV
- Strong profit realization
- Increasing exchange inflows
- Weakening network activity
- Large-holder distribution
These combinations do not guarantee future price movements.
Instead, they help investors understand what is happening beneath the surface of the market.
That distinction is critical.
On-chain analytics should not be viewed as a crystal ball.
It is better understood as a research and risk-assessment framework.
A Simple Rule for Crypto Investors
When analyzing blockchain data, remember three principles:
Look at trends, not isolated events.
Look for multiple confirming signals, not one metric.
Understand the methodology before acting on the data.
A single whale transaction should not determine an investment decision.
A single MVRV reading should not determine a market top.
A single exchange inflow should not automatically be interpreted as selling.
A single increase in active addresses should not automatically be interpreted as adoption.
The broader picture matters more.
The Future of On-Chain Analytics
As the cryptocurrency industry continues to mature, blockchain analytics is likely to become increasingly sophisticated.
Analytics platforms are already moving beyond basic transaction tracking toward:
- Entity intelligence
- Real-time alerts
- Cross-chain analytics
- DeFi monitoring
- Institutional dashboards
- AI-assisted blockchain analysis
- Wallet behavior classification
- Risk scoring
- Automated anomaly detection
The expansion of Layer-2 networks, cross-chain applications, tokenized assets, stablecoins, and institutional blockchain infrastructure will create even more data for investors to analyze.
This could make on-chain analytics an increasingly important component of professional digital-asset research.
However, more sophisticated technology will not eliminate the need for human judgment.
Investors will still need to ask:
What does the data actually mean?
What assumptions were used to produce it?
What information is missing?
Could there be another explanation?
Those questions will remain essential.
Final Investor Checklist
Before making an investment decision based partly on on-chain data, ask:
- Is MVRV relatively high or low?
- What is SOPR showing?
- Are exchange balances changing?
- Are active addresses growing or declining?
- What are large holders doing?
- Are multiple metrics confirming the same trend?
- Are there conflicting signals?
- What does the price chart show?
- What do tokenomics look like?
- How liquid is the asset?
- What are broader macro conditions doing?
- Is the data source reliable?
- Am I interpreting activity as intent without enough evidence?
- Am I allowing one metric to dominate the entire thesis?
If these questions are answered systematically, on-chain data becomes much more useful.
Final Takeaway
Understanding on-chain analytics is not about finding one perfect indicator. It is about learning how to read blockchain activity as evidence.
MVRV, SOPR, exchange flows, active addresses, and whale activity each reveal a different part of the cryptocurrency market.
Together, they can help investors understand valuation, realized behavior, supply movement, network usage, and large-holder positioning.
But the most important principle is simple:
Use on-chain analytics to improve your understanding—not to eliminate uncertainty.
Crypto markets remain volatile and unpredictable. No metric can guarantee a profit or accurately predict every market cycle.
The strongest investors combine blockchain data with fundamental research, technical analysis, risk management, market liquidity, tokenomics, and disciplined decision-making.
In an increasingly transparent digital-asset ecosystem, the ability to interpret blockchain data responsibly can become one of the most valuable analytical skills an investor can develop.
Frequently Asked Questions About On-Chain Analytics
What is on-chain analytics?
On-chain analytics is the process of analyzing publicly available blockchain data to understand cryptocurrency transactions, holder behavior, network activity, supply movement, and market conditions.
Why is on-chain analytics important for crypto investors?
It provides additional information about what is happening directly on blockchain networks. Investors can use it to study holder behavior, network activity, realized profits and losses, exchange movements, and large-holder activity.
What are the five key on-chain metrics investors should track?
Five useful metrics are MVRV, SOPR, exchange flows, active addresses, and whale activity. Each provides a different perspective on cryptocurrency market behavior.
Is MVRV a reliable indicator?
MVRV can be useful for historical valuation analysis, but it should not be treated as a guaranteed market-top or market-bottom signal. It works best when combined with other metrics and broader market context.
Does an exchange inflow mean investors are selling?
Not necessarily. Assets can move to exchanges for many reasons, including trading, custody changes, collateral management, or internal operations. Exchange inflows should therefore be interpreted alongside other evidence.
Are active addresses the same as the number of crypto users?
No. One person can control multiple addresses, while exchanges and applications can control large numbers of addresses. Active addresses measure blockchain address activity rather than confirmed unique users.
What does whale accumulation mean?
Whale accumulation generally refers to large holders increasing their balances. It can indicate increased interest from large entities, but investors should verify wallet ownership and consider other market conditions before drawing conclusions.
Can on-chain analytics predict Bitcoin’s price?
On-chain analytics cannot reliably predict exact future prices. It can provide historical context and evidence about market behavior, but price is influenced by many additional factors, including liquidity, macroeconomic conditions, regulation, sentiment, and market structure.
Is on-chain analytics useful for altcoins?
Yes, but the methodology must be adapted to each blockchain and token. Smaller-cap assets can have more concentrated ownership, lower liquidity, and different transaction structures, making context particularly important.
How often should investors check on-chain metrics?
The appropriate frequency depends on the investment strategy. Long-term investors may focus on weekly or monthly trends, while active traders may monitor daily changes. Investors should avoid allowing short-term noise to dominate long-term decisions.
What is the biggest mistake when using on-chain analytics?
One of the biggest mistakes is interpreting a single metric or transaction without context. Strong analysis combines multiple metrics, historical trends, entity identification, market conditions, tokenomics, and risk management.
Final SEO-Friendly Closing
On-chain analytics gives crypto investors a deeper look beneath the price chart. By tracking MVRV, SOPR, exchange flows, active addresses, and whale activity—and combining those metrics with broader market research—investors can develop a more informed understanding of cryptocurrency market behavior.
The data does not provide certainty.
It provides evidence.
And in a market as dynamic as cryptocurrency, learning how to interpret that evidence can make the difference between simply watching blockchain activity and actually understanding it.